

Since the third quarter of 2017, the global economy has moved through four distinct cycles, including the China-United States trade war (2018 to 2020), the Covid-19 pandemic (2020 to 2021), high inflation and interest rate normalisation during the post-pandemic recovery (2022 to 2023), and global recessionary conditions (2023 onwards).
Among the major economies, the US has emerged as the strongest economy since 2017, with industrial production 1.9% higher than November 2017. Industrial production in the euro area is down by 6.1%, while production in the United Kingdom and Japan contracted by 5.5% and 2%, respectively.
While other advanced economies are still struggling, particularly after the elections around the world, the US is experiencing solid economic growth. Federal Reserve chairperson Jerome Powell made a rare comment last week stating that the US economy “is in a good place overall”. Contrary to other advanced economies, the Fed, by maintaining high interest rates, is well placed to cut rates should unexpected weaknesses occur in the economy.
Protectionism is again the name of the game during Donald Trump’s second term, and although the possible economic fallout of the GOP’s policies is unclear, tariffs are likely to impact heavily on already frail economies, such as Mexico and China. The euro area and developing economies could be particularly vulnerable if Trump slaps tariffs on them.
Yes, America Incorporated is changing rapidly to an enviable position as price-maker instead of price-taker, and its economic growth could be at the expense of other economies (trading or non-trading partners).
What makes the US more exceptional is the fact that unlike most other advanced economies, investment in technology and specifically AI and data centre power needs will drive US economic growth during Trump’s tenure.
Capital expenditure by the four big tech giants – Microsoft, Alphabet, Amazon, and Meta – increased to more than $230 billion in 2024 (1% of GDP) from $129bn in 2021 and is likely to hit approximately $300bn in 2025. The capital expenditure by the rest of the constituents of the S&P 500 increased to $1 426bn (5% of GDP) in 2024 from $1 284bn in 2022.
In addition, OpenAI, through the Stargate Project, undertook to invest $500bn into AI infrastructure over the next four years, of which $100bn will be made immediately.
Saudi Arabia’s Crown Prince Mohammed bin Salman (MBS) also committed to invest $600bn in the US over the next four years, but the investment targets are unknown.
It is therefore possible that the total capital expenditure by the Big Four and OpenAI in 2025 could amount to $400bn, while a quarter of MBS’s commitment could push the number to $550bn, or about 2% of US GDP. From another perspective, it amounts to more than 12% of Germany’s GDP in current terms, 15% of the UK’s GDP, or 1.5 times South Africa’s GDP.
The launch in January this year of DeepSeek, a low-cost Chinese AI model that is significantly cheaper to use than comparable US models such as OpenAI, shook Nvidia and other AI-linked stocks last week. However, it is unclear how this new tech war will unfold. While micro-chips and technology may change rapidly, sources indicate it takes between three and six years to develop a data centre, and analysts estimate that AI servers in operation will increase to about 6 000 by 2027 from about 2 000 and could reach more than 9 000 by 2029.
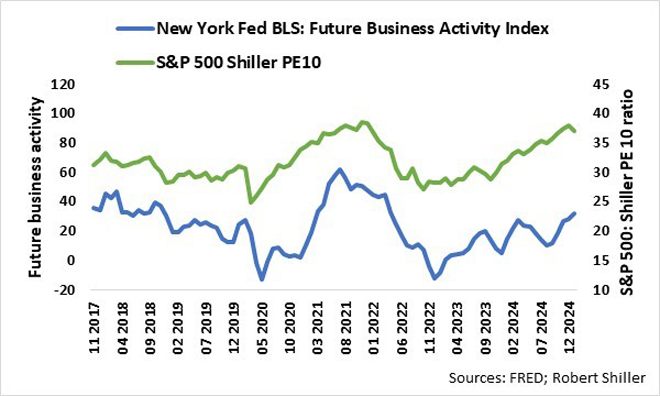
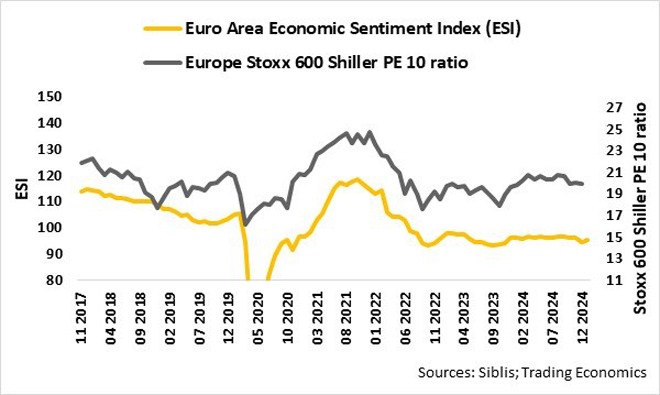
From the graph below it is evident that relative economic activity drives relative valuation metrics.

S&P 500 earnings are currently about 99% higher than in November 2017, far outpacing the Europe Stoxx 600’s 28% in US dollars (47% in euros) and the Japan Nikkei 225’s 58% in US dollars (114% in yen).
The US stock market valuation (S&P 500 PE 10 ratio) narrowly tracks the trend of the future business activity index of the Federal Reserve Bank of New York’s Business Leaders Survey, and as things stand, the upward trend since end 2022 is supportive of relatively high market valuations.
In contrast, the flat trend in the euro area valuation (Stoxx 600 PE 10 ratio) reflects flat euro area sentiment since end 2022.
From a global positioning view, the outlook for the US economy is superior to the euro area. Ditto for US company profit growth. This is why I am overweight in US assets relative to the rest of the world.
Ryk de Klerk is an independent investment analyst.
Disclaimer: The views expressed in this article are those of the writer and are not necessarily shared by Moonstone Information Refinery or its sister companies. The information in this article does not constitute investment or financial planning advice that is appropriate for every individual’s needs and circumstances.

