

The record rally of about 13% in the S&P 500 and 12% in the MSCI All Country World Index (US$) since the March lows caught many investors by surprise and, according to Bloomberg, has “many of the hallmarks of an unloved rally”, citing muted investor sentiment as a red flag. Really?
In my analysis, I focused on the top five US tech stocks because they constitute about 30% of the S&P 500 Index and 17.4% of the MSCI All Country World Index (US$).
Although not technically perfect, because durations differ, I calculated the average long bond yield spread of the Magnificent Five (Nvidia [2050], Microsoft [2045], Apple [2046], Alphabet [2050], and Amazon [2044]) to US 20-year Treasuries.
Looking back since January last year, it appears that the average long bond yield spread of the Magnificent Five to US 20-Year Treasuries (MAG 5 bond yield spread) tended to be a more reliable indicator of actual investor sentiment than suggested by the CBOE Volatility Index (VIX).
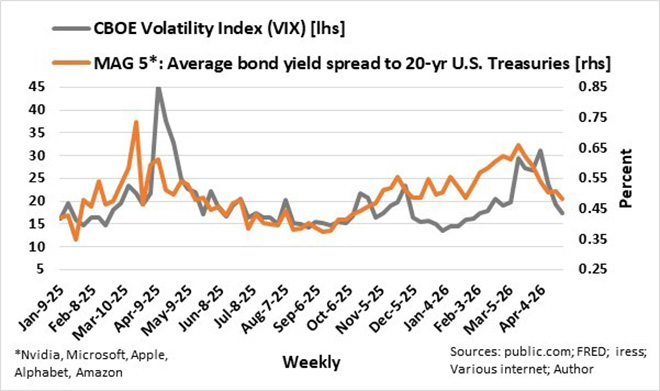
It is also evident that the MAG 5 bond yield spread began to widen before volatility in the stock market increased, specifically in the first quarter of last year and again in the first quarter of this year. Furthermore, the bond yield spread peaked about a week or two before the stock market volatility peaked.
There was a notable deviation between the MAG 5 bond yield spread and the VIX from mid-December last year to the end of January this year, when the yield spread stabilised at higher levels while volatility fell. The start of the US/Israel-Iran war at the end of February saw both the bond yield spread and the VIX surge, with the former reaching the highest level since March last year.
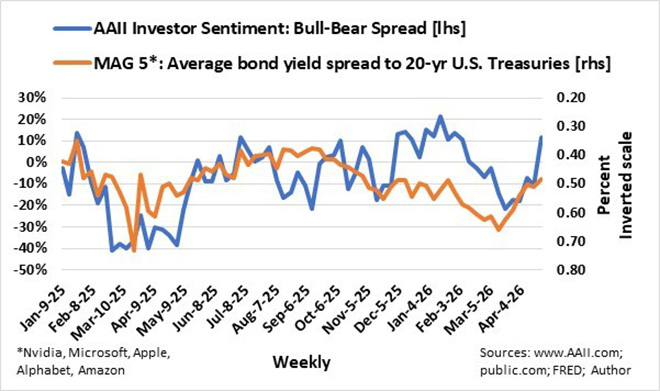
With hindsight, it does seem that the deviation between the bond yield spread and the VIX can be seen as a volatility trap or bull trap. This bull trap is further confirmed in the accompanying graph where the average bond yield spread (inverted scale) is depicted against the American Association of Individual Investors Sentiment Survey’s Bull-Bear Spread, where the percentage of bearish respondents is subtracted from the percentage of bullish respondents.
 The average long bond yield spread of the MAG 5 to 20-Year US Treasuries could be a more reliable indicator of actual underlying stock market sentiment because it is effectively a risk premium the market requires to compensate for uncertainty in the stock market. Significant deviations in investor surveys and volatility indexes from the risk premium trend could indicate bull and bear traps.
The rally in stocks since March lows was justified:
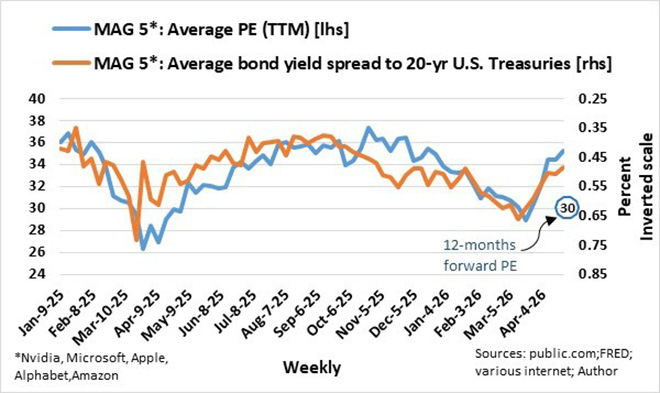
- The average 12 months trailing PE ratio of the MAG 5 reached the same lows as during the worst levels in March last year.
- The average long bond yield spread of the MAG 5 to US 20-year Treasuries was within 7 basis points of the high in March last year.
- The CBOE S&P 500 Volatility Index was at anxiety levels of 30 plus.
- The AAII Investor Sentiment: Bull-Bear Spread was a bearish -22%, the lowest since September last year.
As things stand, I am still somewhat bullish on stock markets in general, but the going is to get tough. Since the latter half of last year, the surge in the issuance of specifically investment-grade bonds driven by AI infrastructure was perhaps the main driving force behind the upward trend in the long bond yield spread of the MAG 5 to 20-year US Treasuries.
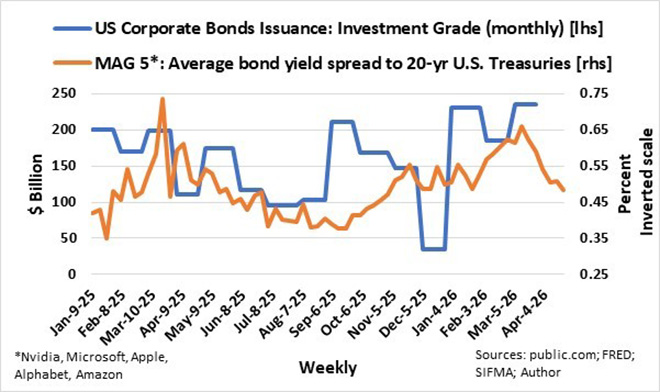
With the average long bond yield spread of the MAG 5 to 20-year US Treasuries back to the pre-breakout levels of about 50 basis points, and increased funding requirements, the scope for a further narrowing of the long bond spread is limited. That, together with the AAII Investor Sentiment Bull-Bear Spread at a bullish +22%, translates into very bullish investor sentiment and increasing the stock markets’ vulnerability to setbacks such as earnings surprises on the downside and geopolitical events.
That is why I do not throw caution to the wind.
Ryk de Klerk is an independent investment analyst.
Disclaimer: The views expressed in this article are those of the writer and are not necessarily shared by Moonstone Information Refinery or its sister companies. The information in this article does not constitute investment or financial planning advice that is appropriate for every individual’s needs and circumstances.

