


Gold is in the middle of a perfect storm. The gold price has been under pressure after hitting a near all-time high at the end of February this year, when Israel and United States attacked Iran.
Seasonal weakness in Chinese gold demand
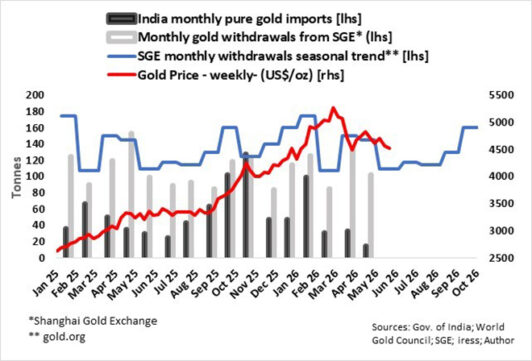
Delivery volume on the Shanghai Gold Exchange (SGE) is an indication of actual Chinese physical wholesale gold demand. The seasonal pattern of gold withdrawals from the SGE (based on the 10-year average between 2016 and 2025) was developed by the World Gold Council and indicates weaker wholesale sales in May and June and a significant recovery in demand in August and September.
Indian demand to be dampened by import tariffs, moral suasion
The same fate awaits the Indian gold market, specifically if last year’s trend is repeated, with lower imports in the second quarter and strong imports in the third and fourth quarters.
The outlook for Indian gold imports and consumption through to the end of 2026 has turned grim. The high oil prices, because of the war in the Middle East, have resulted in India’s raising import tariffs on gold to 15% to ease pressure on the country’s foreign exchange reserves. Furthermore, Indian Prime Minister Narendra Modi urged citizens to avoid gold purchases for a year to alleviate the crisis.
India imported 676 tons of pure gold, or approximately 19% of global mining production, in 2025. It therefore appears that more than 300 tons of gold will need to be absorbed elsewhere in the gold market.
Chinese wholesale demand (monthly gold withdrawals from the SGE) over the past six months was lower than the 10-year average between 2016 and 2025 and is unlikely to compensate for the loss in Indian demand.
Risk-on strategies favour high growth stocks
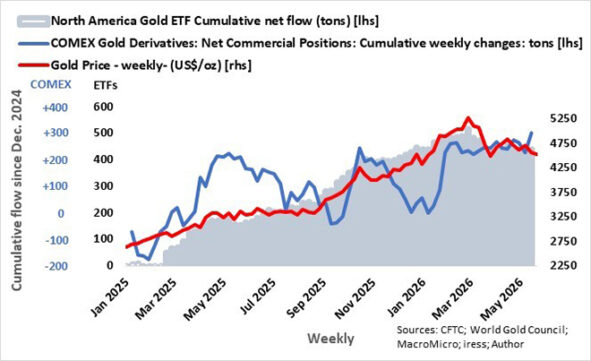
Gold’s near-parabolic rise from September last year was also driven by strong net inflows into North American gold ETFs as investors hedged against risk-on strategies such as the Magnificent 5 (Nvidia, Microsoft, Apple, Alphabet, Amazon – AKA the MAG 5).
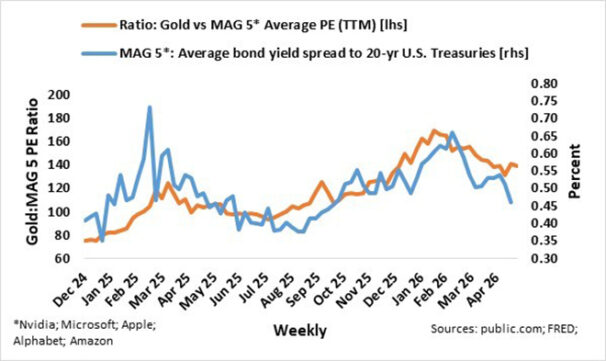
In the accompanying graph, I compare the average long bond yield spread of the MAG 5 to 20-year US Treasuries, an indicator of underlying stock market sentiment, to a relative valuation metric where the gold price is divided by the average PE ratio of the MAG 5.
Both the average MAG 5 long-bond yield spread and the gold-to-MAG 5 PE ratio peaked in the first week of March this year, indicating risk-on growth strategies. It also coincided with net outflows of North American ETFs. At this stage, the average MAG 5 long-bond yield spread is still declining and pointing to further downside of gold relative to the MAG 5 – yes, higher stock market sentiment.
Rate hikes loom
The surge in the oil price since the Middle East war started stoked inflation fears and pushed up global bond yields by more than 50 basis points as rate hikes by central banks are priced into bond prices. As things stand, if the oil price holds, global government bond yields can spike higher. With gold a non-interest-bearing investment, gold loses out as investors seek other assets offering income returns.
It seems that near-extreme levels of risk-on strategies and a significant drop in oil prices will be needed before gold ETFs will see major inflows again.
Gold’s resilience in this perfect storm is remarkable, but it does seem that the trajectory of the gold price is changing. The seasonal strength in Chinese demand is likely to underscore the gold price from the end of August to October, but in the absence of solid Indian demand (imports), this strength will be muted compared with the $1 000 rise in the gold price last year on the back of lofty Indian and Chinese purchases and ETF inflows.
Gold’s near-parabolic rise from September last year to February this year was exacerbated by two significant bouts of short-covering of gold derivatives by commercial players on the Commodity Exchange (COMEX). The positions of commercial entities such as miners, refiners, jewellers, and other end-users who use gold derivative instruments, such as futures and options contracts, are referred to as commercials on the COMEX. They are normally net short (short positions exceed long positions).
Over the past few weeks, commercial players began to close their short positions even further, perhaps indicating a price floor for gold.
I have turned bullish because gold offers reasonable value again.
Ryk de Klerk is an independent investment analyst.
Disclaimer: The views expressed in this article are those of the writer and are not necessarily shared by Moonstone Information Refinery or its sister companies. The information in this article does not constitute investment or financial planning advice that is appropriate for every individual’s needs and circumstance