
Motor, homeowners’, and commercial insurance were the main sources of complaint in the National Financial Ombud Scheme’s Non-life Insurance Division in 2025.
According to the NFO’s annual report, released last week, motor vehicle insurance accounted for 35.4% of all complaints finalised by the division, homeowners’ insurance for 27.5%, and commercial insurance for 12.1%.
Household contents complaints made up 5.1%, while other insurance and non-claim-related complaints accounted for the remaining 20%. Other types of insurance refer to cover such as all risks, mobile devices, travel, legal expenses, personal accident, hospital plan, gap medical, water loss, and pet.
Motor vehicle insurance complaints resolved during 2025 decreased by about 6%, homeowners’ complaints increased by 1%, and commercial complaints decreased by 2% compared with 2024. Other insurance and non-claim-related complaints, combined, increased by 6%, and household contents complaints decreased by 1.5%.
Measured in monetary terms, the Non-life Division recorded R82 888 821 (2024: R94 164 430) in benefit for consumers who approached it for assistance during 2025. That figure sits alongside the 11% (2024: 12%) of complaints that were resolved in favour of the complainant (policyholder) as opposed to the insurer.
DUI now main reason for motor complaints
In motor insurance, the highest number of complaints related to accident claims, which made up 70% of motor complaints considered during the year. Theft and hijack claims accounted for 8%, while mechanical breakdown complaints accounted for 4%.
The report says the primary reason for complaint in the motor category was claims rejected based on a policy exclusion, with the leading exclusion in 2025 being driving under the influence (DUI) of alcohol, which increased by 67% compared with 2024. This exclusion took over from the failure to prevent or minimise loss or damage, also known as a lack of due care, or recklessness, which was the leading rejection reason dealt by the Non-life Division in 2024.
Other recurring sources of complaint in motor matters were misrepresentation and non-disclosure at policy inception, disputes over quantum, and claim delays, which increased by 13%.
Homeowners’ cover: increase in ‘no insured peril’
In homeowners’ insurance, the report says the highest number of complaints finalised related to loss or damage due to acts of nature, at 42%. This was followed by the bursting of water apparatus, at 15%, and theft and burglary, at 5%.
Compared with 2024, there was a decrease of about 1% in complaints related to the bursting of water apparatus, as well as a decrease of 2% in theft and burglary complaints.
The principal reasons for complaint in homeowners’ matters were the rejection of claims based on gradual deterioration, lack of maintenance, or wear and tear, followed by findings that no insured peril had operated, defective design or workmanship, and quantum disputes.
According to the report, complaints linked to gradual deterioration, lack of maintenance or wear and tear increased by 17.5% in 2025, while disputes involving “no insured peril” increased by 25%. Complaints related to defective design/construction/workmanship decreased by 5.5%, while disputes relating to quantum decreased by 15%.
Commercial cover: jump in ‘criteria not met’ complaints
The highest number of commercial complaints resolved related to motor vehicle claims, at 30%, followed by buildings combined, at 24%, theft, at 10.5%, and electronic equipment, at 4.5%.
Compared with 2024, complaints related to motor vehicle claims decreased by 2%, buildings combined increased by 2%, and theft decreased by 2.5%. Electronic equipment remained consistent with 2024’s trend.
In this category, the primary reason for complaints was claims rejected on the basis that the criteria for the insured event had not been met. The report says disputes of this kind increased 88% compared with 2024.
Complaints involving gradual deterioration, lack of maintenance or wear and tear, as well as “no insured peril”, remained consistent with the previous year’s pattern, while quantum disputes increased 6%.
The report identifies further areas of complaint pressure in household contents and in the broader category of other insurance and non-claim-related disputes.
Household contents: 36% rise in ‘no insured event’ complaints
In household contents insurance, theft and burglary accounted for 24% of complaints, power surge for 17%, accidental damage for 12.5%, and acts of nature for 7%.
Compared with 2024, complaints relating to theft and burglary decreased by 8.5%, and accidental damage complaints decreased by 13%.
Power surge complaints decreased by 4% – marking the third consecutive year that power surge-related complaints have decreased following several years of increases.
Complaints related to claims for damage caused by acts of nature decreased by 2%.
The main cause of complaints under this category is claims rejected on a policy exclusion, with the main exclusion being gradual deterioration, lack of maintenance, or wear and tear. There was a 17.5% increase in complaints related to this exclusion.
This was followed by no insured event operated, which increased by 36%, and quantum disputes, which were consistent with 2024’s trend.
All risks: surge in no-premium payment disputes
In the “other insurance and non-claim-related” category, most complaints involved theft or robbery of mobile devices (20%), gap medical (15%), legal expenses (11%), and accidental damage to mobile devices (6%).
Compared to 2024, there was a decrease of 11% in complaints related to theft and robbery of mobile devices. Gap medical complaints increased by 5%. Complaints related to legal expenses and complaints related to accidental damage to mobile device each decreased by 4%.
Non-claim-related policy complaints decreased by 10%.
The primary cause of disputes in this category related to claims rejected based on the criteria for the insured event not being met. This was followed by the non-payment of premiums and no insured peril.
Disputes related to the non-payment of premium showed a notable increase of 75% compared to 2024. Disputes related to no insured peril, quantum disputes, and delays also increased significantly.
Insurers with the most complaints
This link will open a table showing the 25 insurers (participants) about which the Non-life Division received the most complaints.
The table does not compare complaint volumes with market share or policy counts, so it does not support a ranking of insurers by conduct or performance. It does, however, indicate where complaint traffic was most heavily concentrated within the non-life sector.
A useful feature of the table is the column showing matters that were converted from premature to formal. That data indicates that a meaningful share of complaints progressed beyond the initial stage at which insurers have an opportunity to resolve them directly.
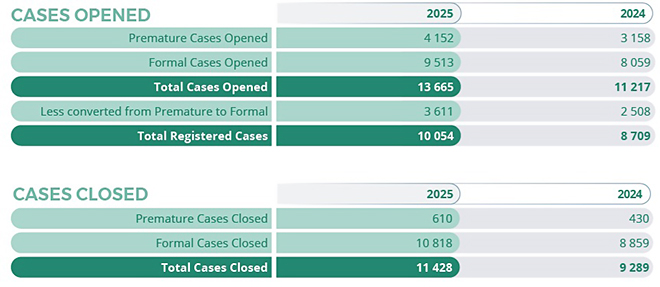
The Non-life Division opened 4 152 premature cases and in 2025, compared with 3 158 in 2024. It should be noted that the NFO’s 2024 report covered March to December only, rather than a full 12-month period. It opened 13,665 formal cases opened, and 9,513 matters converted from premature to formal in 2025. At participant level, that pattern points to a complaints environment in which a substantial number of disputes were not resolved at first touch and instead moved into the ombud’s formal investigation process.
The table is most revealing in its final columns, which record the number of formal complaints finalised with some benefit to the insured and the resulting resolved ratio. The Division’s overall resolved ratio in 2025 was 11%, describing it as an indicator of those complaints where the insurer’s decision or approach was changed with some additional benefit to the insured.
The participant table shows variation around that benchmark. Vodacom Insurance Company recorded a resolved ratio of 26%, Guardrisk 20%, Old Mutual Alternative Risk Transfer 17%, and Legal Expenses Insurance 15%. By contrast, OUTsurance recorded 3%, King Price 4%, Auto & General 4%, MiWay 5%, and Compass 5%.
Those differences should be treated cautiously. A higher resolved ratio does not, by itself, prove weaker claims handling, any more than a lower ratio proves stronger conduct or sounder decision-making. The report does not provide the additional context that would be needed for that kind of conclusion, such as the size of each participant’s book, the composition of its business, or the proportion of complaints relative to its policyholder base.
Unacceptable service
The annual report’s Treating Customers Fairly (TCF) analysis gives a further indication of how complainants experienced non-life disputes.
According to the report, 93% of all complaints resolved had identifiable TCF outcomes, and a complaint could have more than one applicable outcome.
The most prevalent outcomes were that 51% of complainants did not feel that they were provided with a service from their insurer that was of an acceptable standard, while 44% were not confident that they were dealing with an insurer where the fair treatment of policyholders is central to the insurer’s culture.
A smaller proportion of complainants – 2% in each instance – felt that they had not received suitable advice taking their circumstances into account or were not provided with products that performed as they had been led to expect.
Operational performance
The Division registered 10 054 complaints in 2025 and resolved 11 428 complaints. At the end of 2024, 529 legacy/OSTI complaints were still to be resolved; by the end of 2025, that number had been reduced to eight.
The division ended the year with 3 757 open or active complaints, compared with 5 075 at the end of 2024.
According to the report, the combined average turnaround time to resolve complaints across both legacy and NFO matters was 105 working days, down from 117 days earlier in the year. The report attributes that improvement to increased staff capacity at the start of the year and a decline in newly registered complaints in the second half, both of which contributed to improved complaints-handling efficiencies.

