

Since 1980, the US yield curve (yields on cash or near-cash equivalents measured by 3-month US Treasury bills minus longer-dated Treasury yields) almost always steepened (yields on the 3-month bills declined more than yields on the longer-dated Treasuries) when yields on the 3-month Treasury bills began to decline in real terms. I used the US GDP deflator as the inflation rate. The onset of the declines coincided with the start of a US economic recession.
The yield curve, measured by the yield on 3-month and 10-year Treasuries, at plus 1.23% is currently at the top of the range since the first quarter of 1980, while the average through the business cycles was about minus 2%. The yield on the 3-month Treasury, adjusted for inflation (GDP deflator), is currently at the highest since 2008.
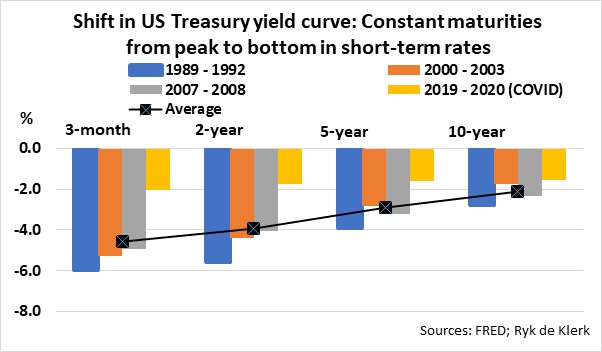
The shifts in the US Treasury yield curve, across the 3-month, 2-year, 5-year, and 10-year constant maturities from peaks (at the onset of recessions) to bottoms in short-term interest rates (three months) were remarkably similar in the periods 1989 to 1993, 2000 to 2003, and 2007 to 2008. The suddenness of the Covid-19 crisis led to a downward adjustment of about 2% of the entire yield curve across all constant maturities – yes, an already flat yield curve shifted 2% south.
Will history repeat?
Although some will question the argument, it is likely that history will repeat. The steepness and duration (how long it will take from the peak to the bottom of the 3-month Treasury bill yields) are, however, very difficult to forecast.
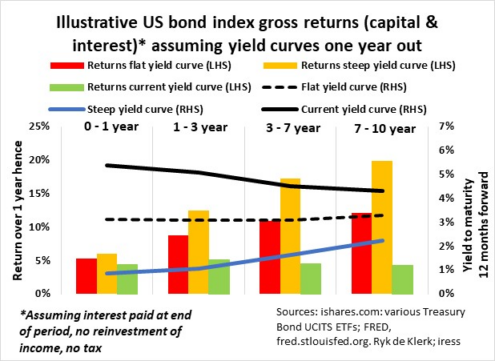
For illustrative purposes only, I assumed that the average of the shifts in the US Treasury yield curve, across the 3-month, 2-year, 5-year, and 10-year constant maturities in the periods 1989 to 1993, 2000 to 2003, 2007 to 2008, and 2019 to 2020 could be a good guide of what is about to happen over the next 12 months. The average shifts were subtracted from the current yield curve to determine the yield curve 12 months down the line.
As a second scenario, I assumed that only half of the average of the shifts in the US Treasury yield curve is about to happen over the next 12 months. In fact, in the US it eventuates into a lower, flat yield curve.
I used a simple way to calculate the total return on US Treasury Bond Indexes 12 months hence by applying data and metrics such as yield-to-maturity and modified duration from various iShares Treasury Bond UCITS ETF fact sheets and the shifts in the US Treasury yield curves, as previously mentioned.
With increasing evidence pointing to an end to the tightening cycle by the Federal Reserve, it does seem to me that the time has arrived for US investors to increase the duration of their interest-bearing investments and to reduce their exposure to cash or near-cash investments to reasonable levels.
Investments in cash or near-cash equivalents or bonds and fixed deposits with a duration of less than six months require rollovers when they come to the end of their terms. A downward spiral in short-term rates can therefore be detrimental to investors, as lower rates are locked in.
But risk management is of the utmost importance, as an inflation-linked Black Swan event such as surging oil prices due to geopolitical strife could easily turn the tables and force the yield curve higher, resulting in capital losses, specifically in five-year-plus government bonds.
How the SA yield curve compares
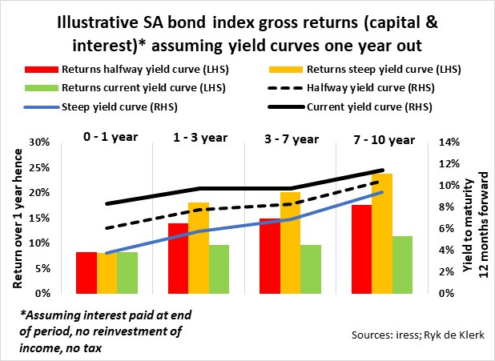
The average shifts in the South African Treasury yield curve, across the 3-month, 2-year, 5-year, and 10-year constant maturities from peaks (at the onset of recessions) to bottoms in short-term interest rates (three months) were remarkably similar to those in the US.
I calculated the illustrative total return on SA government bond indexes 12 months hence by applying data and metrics such as yield-to-maturity and modified duration from Iress and the shifts in the US Treasury yield curves as previously mentioned.
Contrary to the lower, flat US yields curve at the end of the term, where it is assumed that half of the average of the shifts in the US Treasury yield curve is about to happen over the next 12 months, the South African yield curve remains steep where longer dated bond yields are much higher than yields on cash or near-cash equivalents or bonds with a duration of less than six months.
With South Africa’s government in dire straits, having run out of money, the yield curve can eventually end up much steeper because of investors specialising in distressed debt requiring even higher risk premiums, specifically in the seven-year-plus duration area.
Timing is of the essence
Anecdotal evidence suggests that the South African Reserve Bank will continue to align its monetary policy with central banks such as the Fed and European Central Bank (ECB). With the end to the tightening cycle by the Fed and ECB around the corner, I believe the time has come for South African investors to increase the duration of their interest-bearing investments and to reduce the exposure to cash or near-cash investments to reasonable levels.
Timing is of the essence. South African short-term rates have already started the next downward trend. According to Iress, the JIBAR six-month monthly yield has dropped to 8.625% from a high of 9.225% on 2 June, and the three-month rate to 8.33% from 8.5% on 20 July.
I am not against investing in a single government bond, but I prefer to invest via listed government bond index exchange traded funds (ETFs) and bond index-tracking unit trusts because they are diversified and rebalanced according to size and maturity – yes, they do the administration for you. For liquidity reasons, I also prefer the said ETFs and unit trusts to fixed deposits because, in the latter case, you are fixed for a period and could be obliged to pay a penalty and forego some interest if you end the contract prematurely.
The tax issues surrounding investing in bonds can be very complex and could determine what type of instrument will be most suitable from a tax point of view.
To me, the current US and SA bond yields in the three- to five-year area offer exceptional opportunities from a risk/return point of view. To mitigate against a possible economic implosion and hyperinflation in South Africa, I hold a healthy balance of US Treasuries and SA government bonds.
That is why I increased the duration of my interest-bearing investments and hold cash for tactical purposes only.
Ryk de Klerk is an independent investment analyst.
Disclaimer: The views expressed in this article are those of the writer and are not necessarily shared by Moonstone Information Refinery or its sister companies. The information in this article does not constitute investment or financial planning advice that is appropriate for every individual’s needs and circumstances.


Thank you Ryk excellent article.