

Bitcoin had a boom-bust roller-coaster past, but the unfolding of Bitcoin’s price discovery since the end of 2022 has been a formidable experience.
According to Investopia, “price discovery is the process by which buyers and sellers establish the spot price or the proper price for a security, commodity, or currency”. Yes, supply and demand, where the price at which current holders will be prepared to sell depends on the financial strength of the holders, recent price trends, and their expectations of the asset’s future performance and new supply.
On the other hand, the price the buyers will be prepared to pay depends on their expectations of the asset’s future performance, new supply, needed quantities, and the quantities for sale by current holders/owners.
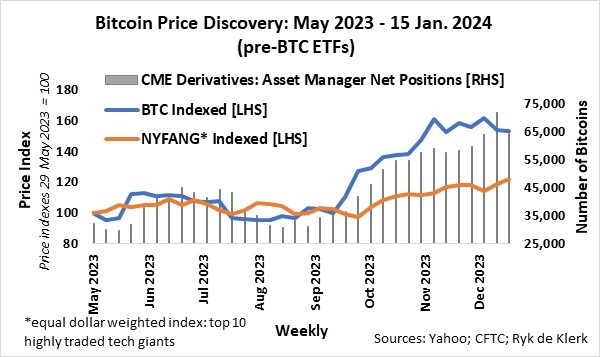
The first leg of Bitcoin’s price discovery was when Bitcoin steadied by mid-2022 and behaved like a big tech stock from June 2022 to September 2023, trading in line with the NYSE FANG+ Index, an equal dollar weighted index consisting of 10 of the highly traded tech giants: Meta, Apple, Amazon, Netflix, Microsoft, Google, Tesla, Nvidia, Snowflake, and Advanced Micro Devices.
Note: The inflows and outflows in US dollars per trading day were assumed to be converted to Bitcoin by applying the BTC exchange rate at New York’s close. The actual number of Bitcoins that changed hands may therefore differ from the assumed numbers.
In an article published by Moonstone in July last year, Why I (want to) own Bitcoin, my bullish case for Bitcoin was built on the increasing likelihood that Bitcoin would be adopted as an investable asset by the asset management industry and the rising cost of mining Bitcoins.
The second major Bitcoin price discovery started in October last year as the likelihood of successful filings of Bitcoin ETFs increased significantly. Since mid-October, the net asset management position published by the Commodity Futures Trading Commission surged from 36 000 coins to nearly 75 000 coins a week prior to the listing of Bitcoin ETFs in mid-January this year.
The surge in demand saw the US dollar price of Bitcoin increasing by 38%, outstripping the 22% rise of the NYFANG Index over this period.
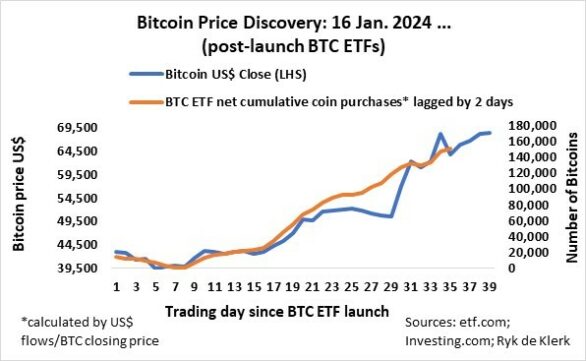
The next and ongoing price discovery started in mid-January with the listing of Bitcoin ETFs – yes, the official adoption of Bitcoin as an investable asset.
On the surface, the first net flows experienced by the Bitcoin ETFs were disappointing, as net outflows occurred in eight out of the first ten business days, while asset managers cut their net long positions in Bitcoin futures and options by more than US$400 million, exerting downside pressure on Bitcoin’s price.
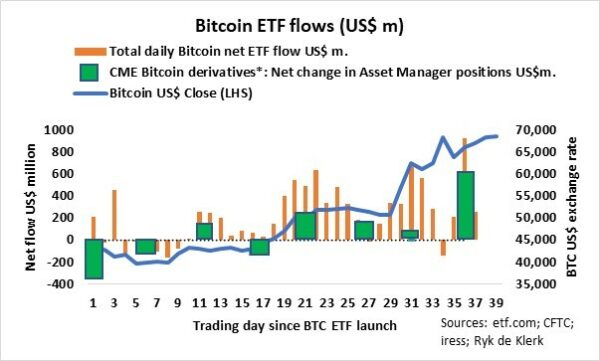
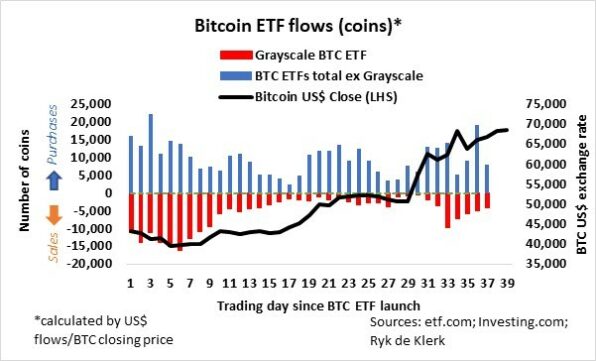
But there was more than meets the eye. Grayscale Bitcoin Trust became the first publicly traded Bitcoin fund in 2015. According to Reuters, Grayscale had been unsuccessful in trying to convert the trust into an ETF, and the trust tended to trade at huge discounts to its underlying assets. It attracted the attention of hedge funds and took profits when the trust obtained regulatory approval for the conversion to an ETF (GBTC) in early January.
Other approved Bitcoin ETFs (BTCO, IBIT, FBTC, BITB, ARKB, EZBC, BRRR, HODL, BTCW), on the other hand, experienced huge inflows, but the excess supply because of Grayscale Bitcoin ETF outflows drove Bitcoin’s price lower. Bitcoin’s price normalised when Grayscale’s outflows eased and gained further traction as the supply from Grayscale dwindled.
Bitcoin’s price started to take off when demand from other Bitcoin ETFs began to exceed supply (outflows) from Grayscale in the second week of February.
At this stage, the available data shows that Bitcoin’s price is highly correlated (R-squared = 0.97) to the cumulative net coin purchases by Bitcoin ETFs lagged by two days, where the lag can be due to differences in time zones and reporting.
Who knows what the future holds for Bitcoin.
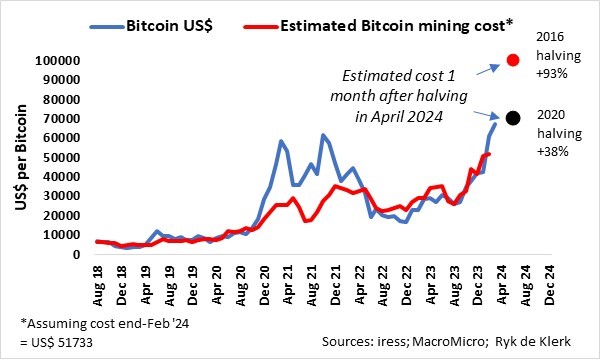
The current mining cost of 1 Bitcoin is estimated at about US$52 000. After the 2016 halving event, the cost of mining rose by more than 90% one month after the halving event, and 38% after the 2020 halving event. The mining cost of Bitcoin could therefore jump to between US$70 000 and US$100 000 after the April 2024 event.
After the halving event in April, the daily issuance of new Bitcoin is set to drop to about 500 a day. The current demand by Bitcoin ETFs is about 3 000-plus on average a day, therefore six times the daily issuance of new coins.
I agree with BlackRock’s ad campaign that Bitcoin’s price discovery since mid-2022, specifically since the launch of the Bitcoin ETFs in January, is showing a shift from a volatile and speculative asset to a mainstream asset, to be owned alongside traditional investments such as stocks and bonds.
Bitcoin has become a significant market. Its current market capitalisation is more than US$1.2 trillion, six times the value of total gold ETF holdings and about 8% of the value of total above-ground stocks of gold. Bitcoin’s market cap is about 56% of Nvidia’s market cap and 4.5 times the M3 money supply of South Africa.
The concurrence of the halving and the adoption by investors via Bitcoin ETFs is undeniably shaping Bitcoin’s price discovery.
It is exceedingly difficult or even impossible to estimate where Bitcoin’s price could top out, as Bitcoin’s price is already reflecting a possible 38% jump in mining costs (if I take my cue from the impact of the 2020 halving event). It could even reach US$1 million in a year’s time if I extrapolate the current net purchases trend.
The question is therefore at what price will the big holders start to cash in, as the primary supply is running dry. Secondary supply is also limited. Approximately one-third of the Bitcoins held by Grayscale Bitcoin ETF (GBTC) pre-conversion to an ETF have already been sold. The remaining Bitcoin holdings of the ETF are roughly equal to the total number of coins purchased by the other Bitcoin ETFs since their listings in mid-January this year.
All I know is that Bitcoin is in short supply, and it could remain in short supply in the foreseeable future, and its price discovery therefore justifies a core holding in my total investment portfolio. It could enhance the risk-return trade-off.
Ryk de Klerk is an independent investment analyst.
Disclaimer: The views expressed in this article are those of the writer and are not necessarily shared by Moonstone Information Refinery or its sister companies. The information in this article does not constitute investment or financial planning advice that is appropriate for every individual’s needs and circumstances.

