

It is increasingly evident that investors are becoming more cautious by the day about global stock markets, as they are buying more put options than call options and driving volatility higher.
Volatility, the measure of how much an underlying asset’s price will fluctuate over time, is one of the main variables used in calculating the price or premium of an option on an underlying asset.
A call option gives the owner the right to buy the asset at a specific or strike price, while the counterparty or writer of the call option is obliged to deliver the asset to the owner of the option when the option is exercised.
In the case of a put option, the owner of the put option has the right to sell the asset at a specific or strike price, and the counterparty or writer of the put option is obliged to buy the asset at a specific price from the owner of the option when the option is exercised.
The other main variables used in the calculation and pricing of options are the price of the underlying asset, the time until the exercise or maturity of the option, and the risk-free interest rate. That is why an option, although out-of-the-money – in the case of call options, price is lower than the strike price, and in the case of put options, price is higher than the strike price – still has value.
According to the Chicago Board of Exchange (CBOE), the VIX Index estimates the expected volatility by aggregating the weighted prices of the listed put and call options on the S&P 500 Index over a wide range of strike prices. Options with more than 23 days and less than 37 days to expiration are used to calculate the VIX Index, and these options are weighted to yield a constant maturity 30-day measure of the expected volatility of the S&P 500 Index.
Volatility (VIX) is supply and demand driven.
When the prices or premiums of options rise, while the price of the underlying asset remains unchanged, it effectively means that higher volatility is priced in the prices of the options. This higher volatility, reflected by VIX, indicates a greater perceived market risk, and market participants are willing to pay more for insurance against large upswings or downswings.
The relationship between VIX and the market valuation (Shiller’s earnings yield is based on average inflation-adjusted earnings from the previous 10 years) for the S&P 500, from 2004 to February 2020, was linear. Higher volatility (VIX) is associated with lower valuations and therefore a lower S&P 500 index, and vice versa, lower volatility with higher valuations.
There was, however, a diversion between the two series from the outbreak of the Covid-19 pandemic until the fourth quarter 2022, but it was mainly because of the valuation curve shifting lower due to the massive quantitative easing by the Fed and other central banks to get the economies on the road again. The trends in VIX and the S&P 500 valuation remained similar, though.
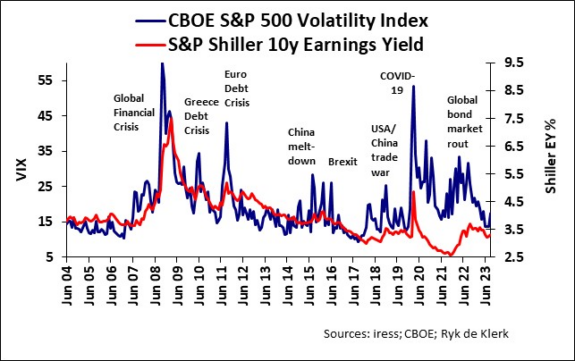
Yes, the S&P 500 was extravagantly overpriced relative to VIX until the global bond market rout started on the eve of aggressive quantitative tightening by the major central banks and the fall-out of Russia’s invasion of Ukraine. It does seem that the historical relationship between VIX and the S&P 500 valuation metric was restored.
Large spikes in VIX and the derating of stocks and stock indices are generally event and specifically crisis-driven. VIX also tends to overshoot on the upside relative to market valuations.
Delta hedging is a popular but complex trading strategy used by asset managers and large investment companies, where a hedge is achieved using options.
Delta hedging requires constant rebalancing to ensure risk is hedged, especially where options are written or sold against a position in the underlying asset. A sudden spike in volatility may result in in an imbalance in volatility held, as the movement in the underlying asset may move out of line with that of the option position, inter alia forcing the trader to buy back options and drive-up volatility further.
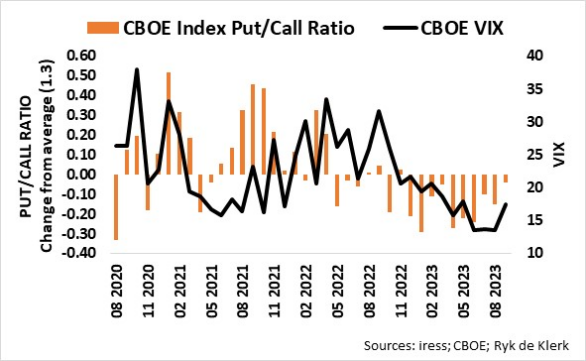
The CBOE Index Put/Call Ratio is calculated by the weekly total volume of put options traded on the CBOE divided by the total volume of call options.
Since 2018, the average index Put/Call Ratio was about 1.3, mainly due to put option hedging by asset managers. It is apparent that the actions of asset managers tend to have a significant impact on the volatility of index options. A change in the Put/Call Ratio to above or below the average (neutral) tends to coincide with a VIX trend change, while in some instances the change leads VIX.
From the accompanying graph, it is evident that the Index Put/Call Ratio is approaching the neutral (the historical average), and VIX is following it higher. It does seem that the downtrend in VIX since October last year has been arrested.
Considering the historical relationship between VIX and the S&P 500 valuation, US and global stocks are staring down the barrel, as a derating is on the cards.
Ryk de Klerk is an independent investment analyst.
Disclaimer: The views expressed in this article are those of the writer and are not necessarily shared by Moonstone Information Refinery or its sister companies. The information in this article does not constitute investment or financial planning advice that is appropriate for every individual’s needs and circumstances.

