
Stock market indices worldwide continue to surprise on the upside, virtually making new highs daily. Yes, savour the moment, because the tailwinds of prospective monetary policy easing by the Federal Reserve and the central banks of other countries in the coming months are likely to be overtaken by severe headwinds.
No, it is unlikely to be like President Donald Trump’s sweeping tariffs announcement that caused a “buy the dip” opportunity in April.
The conditions precedent
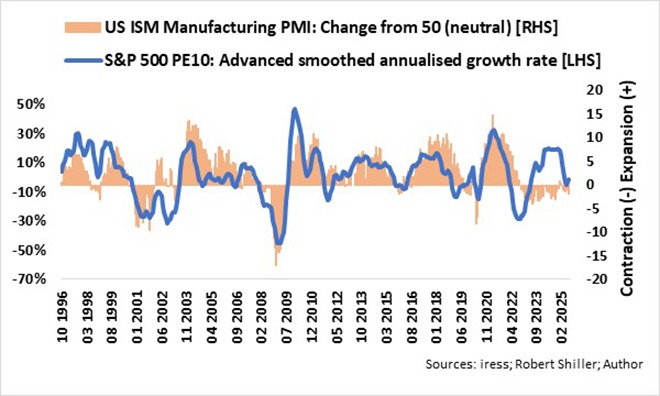
My advanced smoothed annualised growth rate of the S&P 500 PE10 ratio has been a reliable leading indicator of the US’s manufacturing sector over the past 30 years. It tends to lead the manufacturing cycle, measured by the ISM Purchasing Managers Index (PMI) by two to three quarters. (This cyclically adjusted price-to-earnings ratio uses average earnings over the past 10 years and smooths out the impact of business cycles.)
It is evident that the growth cycle of the S&P PE 10 that began in mid-2023 was not followed by a recovery in the PMI, because the latter has remained in contraction territory (below 50) since then. The S&P PE10’s smoothed annualised rate has lost momentum since the end of March this year and is on the verge of turning negative.
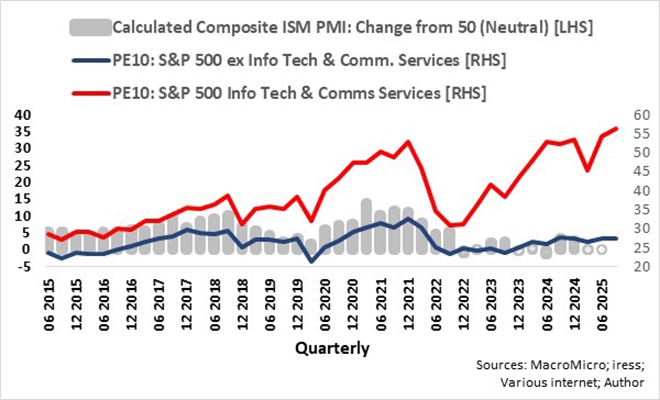
It appears that the S&P PE10’s smoothed annualised rate since 2023 was mostly driven by the information technology and communications services sectors combined because the other components of the S&P 500 merely reflected the improved conditions in the services sector of the economy, with the composite ISM PMI (calculated in the ratio of 20% manufacturing and 80% services) recovering modestly in 2024.
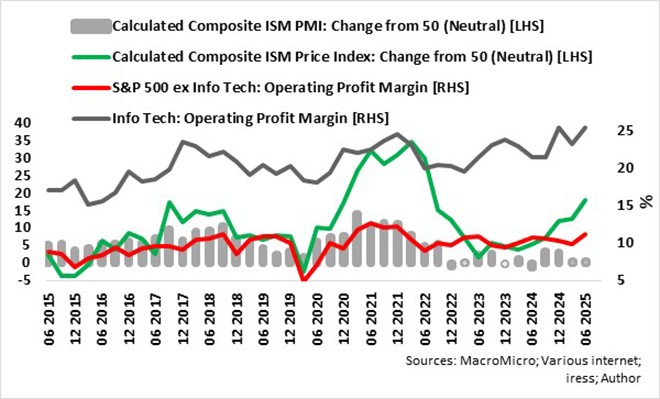
It is evident that the S&P 500 information technology/communications sectors are in a much better position than the rest of the S&P 500 sectors to transfer the rising costs of input and, furthermore, to leverage profit margins on rising costs. Yes, the vacuum between manufacturing and stock market valuation was filled by improved efficiencies.
Going forward
Major Wall Street banks have adjusted their targets for the S&P 500 at the close of 2025. According to MarketWatch and Morningstar, on 15 August, the average year-end target for the S&P 500 was 6 400, virtually slap-bang on Friday’s close of 6 450. The total return for the S&P 500 until the end of this year is close to 0%. As always, the stock market can surprise on the upside because market forces may push equities over the top.
In comparison, the US government bond yield curve for two to five years offers a yield of about 1.6% over the same period, relatively risk-free. To match and outperform US government bonds, the S&P 500 needs to clear 6 500 by the end of 2025.
Earnings could surprise on the downside
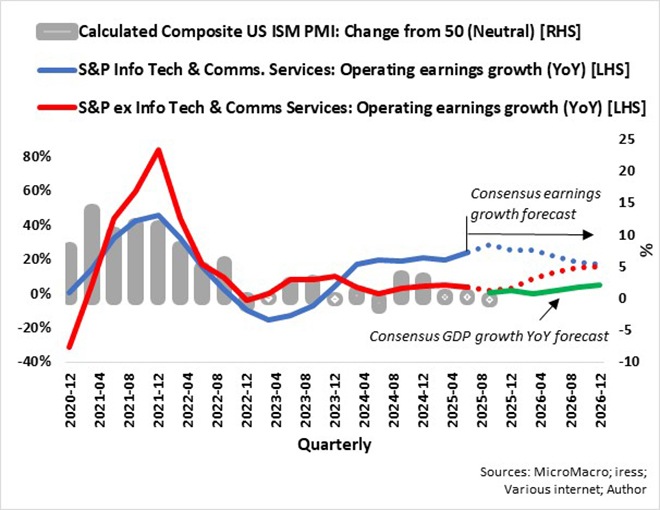
It seems that consensus (from various sources) bottom-up operating earnings growth forecasts for S&P 500 companies, excluding information technology and communications services, are overly optimistic given GDP forecasts through end-2026 because earnings growth could pan out more than 5% lower than currently forecast.
The ability to leverage profit margins is also about to diminish because, in general, US investment banks are forecasting a peak in inflation (PPI and CPI) in the third quarter of 2025 and trending lower through mid-2026.
The forward PE ratio of the S&P 500 index may therefore be too low.
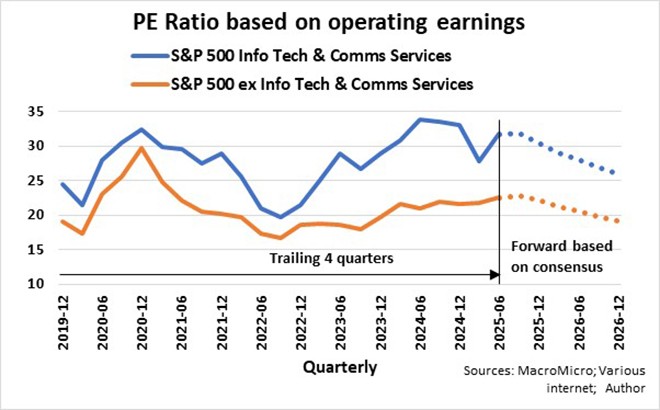
The four quarters’ forward PE ratio based on operating earnings for the combined S&P 500 information technology and communications services sectors, according to analysts’ forecasts, is currently at about 27, while the forward PE of the other sectors of the S&P 500 combined is about 20. However, downside earnings surprises could result in forward PEs of 30 and 22-plus, respectively.
Will interest rate cuts prevent a meltdown?
It is worthwhile to compare the stock market reaction during the initial stages of the Federal Reserve cutting interest rates since 2000.
From October 2000 to February 2001, the Fed cut interest rates from 6.6% to 5.6%, the ISM manufacturing PMI dropped from 48.7 to 41.1, and the S&P 500 PE10 fell by 9%. From July to November 2007, the Fed cut interest rates from 5.3% to 4.7%, the ISM manufacturing PMI dropped from 52.3 to 50, and the S&P 500 PE10 fell by 6%. From July to October 2019, the Fed cut interest rates from 2.4% to 1.6%, the ISM manufacturing PMI dropped from 51.3 to 48.5, and the S&P 500 PE10 fell by 1%. All three cases were followed by major drawdowns because of major crises or Black Swan events (rare events with profound consequences, according to Nassim Taleb, author of The Black Swan: The Impact of the Highly Improbable): 2001: Dotcom crisis; 2008 Global Financial Crisis; 2020: Covid-19.
In a recent article (“I prefer US government bonds ahead of corporate bonds”), I concluded that “US corporate bonds reflect the current elevated stock market valuations as measured by the PE10 of the S&P 500”. A prolonged drawdown in equities could lead to a serious global liquidity crisis because corporate bonds’ yield spread to US treasuries can widen significantly.
The contagion could be worldwide. That is why I turned bearish on risk assets and cut my return expectations.
Ryk de Klerk is an independent investment analyst.
Disclaimer: The views expressed in this article are those of the writer and are not necessarily shared by Moonstone Information Refinery or its sister companies. The information in this article does not constitute investment or financial planning advice that is appropriate for every individual’s needs and circumstances.