
What will happen in the US stock market in 2026 is likely to have a ripple effect on major sectoral indices worldwide. As uncertainties abound, we as investors can think out any scenario and try to guess the outcomes. What we know is that stock markets worldwide are reaching new highs. The big question is: How high is the bar for perfection?
In the long run, the stock price of a company is driven by its financial health as reflected in the shareholder’s interest, also known as book value or net asset value, and consists of share capital, share premium, retained income, and reserves. Stronger growth in the book value of a company relative to other companies often leads to the stock price outperforming the market and commanding a high market value relative to book value, reflecting robust growth expectations. The same can be said of the individual S&P 500 sectors, as the price-to-book ratios tend to indicate at what stage the sector is in its life cycle.
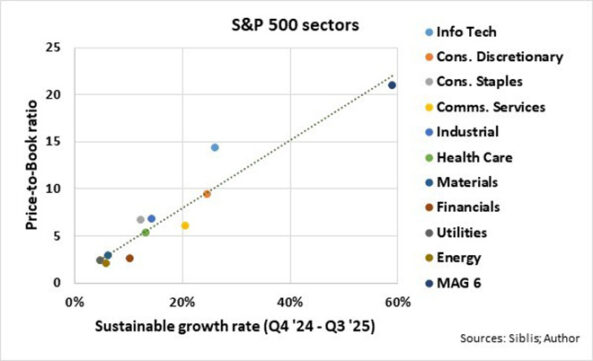
Furthermore, there tends to be a direct link between the price-to-book ratios and the rate of growth that companies and S&P 500 sectors can expect to see in the long term – also known as the sustainable growth rate. According to the Corporate Finance Institute, the sustainable growth rate is calculated by multiplying a company’s earnings retention rate by its return on equity. With earnings and dividend yields, as well as the price-to-book ratios, of the individual S&P 500 sectors known, the average sustainable growth rates over the past four quarters are plotted against the latest price-to-book ratios of the individual S&P 500 sectors. For illustration purposes, the simple averages of the MAG 6 (Nvidia, Apple, Microsoft, Alphabet, Amazon, and Meta) are also included.
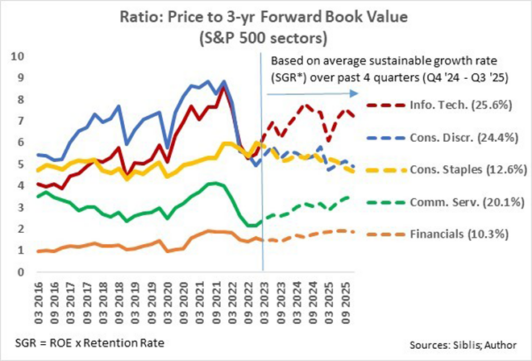
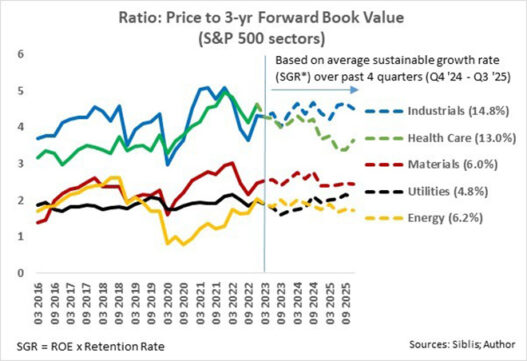
Assuming that the market is forward-looking, I plotted the price-to-book value three years hence of the sectors historically since 2016 and applied the average sustainable growth rates over the past four quarters to the calculated book values as of 31 December last year.
From the above, it appears that virtually all sectors are priced fairly, except information technology, which is somewhat but not overly richly priced. But it appears to be the most favourable expectation, because, according to textbooks, the sustainable growth rate is an indication of the maximum amount a company’s sales and profits can grow without requiring more cash from debt or equity.
But how realistic are these expectations?
Retained earnings are not the only factors that influence shareholder’s equity or book value. Other factors are taking on new debt, share repurchases, depreciation or impairment of assets, and unrealised gains or losses because of foreign currency translation adjustments or pension plan adjustments.
My analysis indicates that the growth in book values of the individual sectors over the past five years were about half the average sustainable growth rates over the past four quarters.
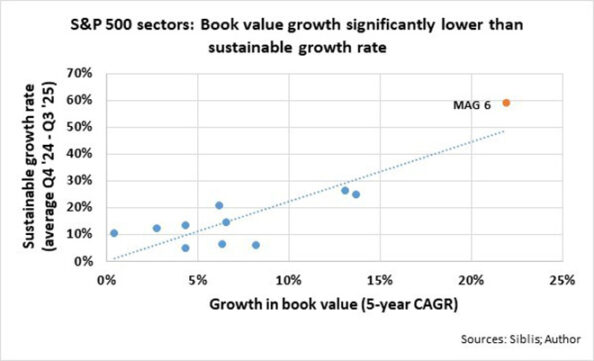
By factoring in the growth rates in book value over the past five years to the calculated book values as of 31 December last year, the price to book values one, two, and three years hence are plotted per sector as of 31 December last year.
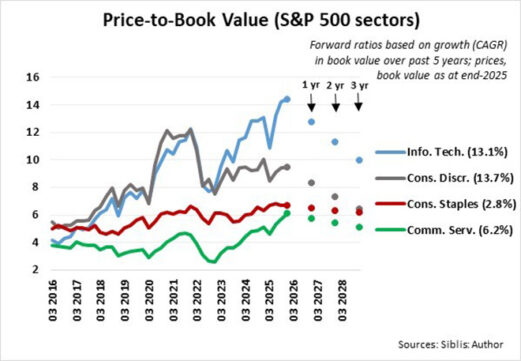
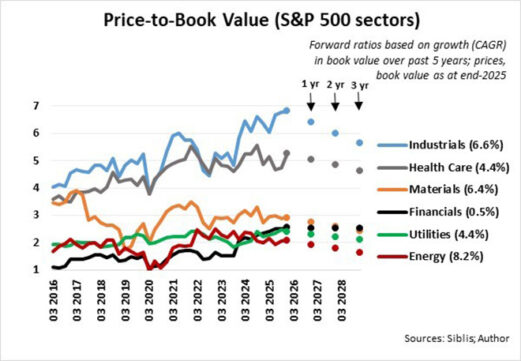
It is evident that paltry growth and risk skewed on the downside lie ahead for information technology, communication services, financial, and industrials sectors unless the book value of these sectors accelerates over the next two to three years, because it may take up to three years for their respective price-to-book ratios to revert to the average over the past three years.
Consumer discretionary, energy, consumer staples, and materials are inexpensively priced with a lower risk profile, while my take on the S&P 500 utilities and healthcare sectors is neutral: therefore, market neutral.
Yes, with some S&P 500 sectors’ price-to-book ratios reflecting the maximum amount the sectors’ sales and profits can grow, the bar for perfection in those sectors is set very high, but opportunities abound to limit downside risk and protect capital through sector rotation and stock selection.
Ryk de Klerk is an independent investment analyst.
Disclaimer: The views expressed in this article are those of the writer and are not necessarily shared by Moonstone Information Refinery or its sister companies. The information in this article does not constitute investment or financial planning advice that is appropriate for every individual’s needs and circumstances.