

“Sell in May and go away” is an old stock market adage that crosses my mind year after year. The trading strategy involves selling equities in May and buying them back in October because the period historically tends to have weaker stock market growth than from November to April.
Several academic studies back up the theory. According to Wikipedia, a “study by Andrade, Chhaochharia and Fuerst (2012) found that the seasonal pattern persisted. In the 1998–2012 sample, on average November–April, they found that returns are larger than May–October returns in all 37 markets they studied. On average, the difference is equal to about 10 percentage points.”
But how successful is the sell-in-May strategy from a trading point of view, where you sell in May and buy back later that year?
I decided to look at the maximum drawdowns of the S&P 500 Index from the highs in May to the lows until the end of each year since 1995. I define a “sell in May success” when the drawdown exceeds 4%. The strategy was successful in 16, or 59%, of the 27 years analysed, with an average drawdown of about 15%, ranging between 5% and 46%. The average duration of the drawdown was 3.5 months, ranging between one and seven months.
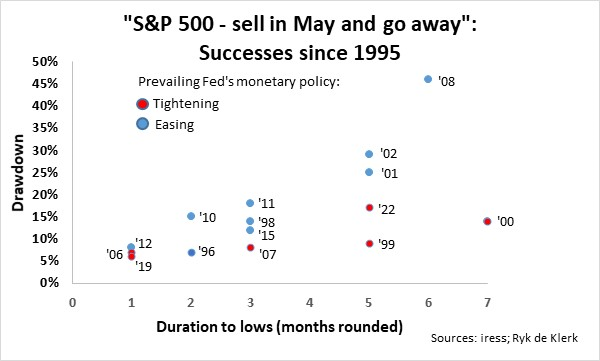
For the strategy to be successful, the S&P 500 needs to be bought at the point of the maximum drawdown. Yes, your timing must be perfect, and very few investors, if any, can achieve that.
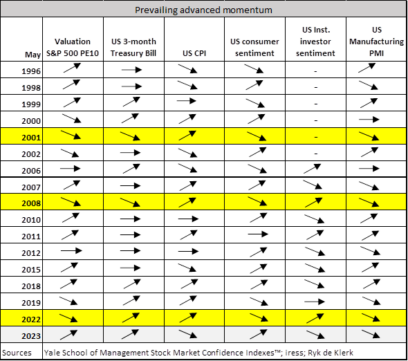
I decided to compare each year’s “sell in May successes” on prevailing trends at the time of selling of some of the most important factors influencing US stock market returns in general, to ascertain whether there could be warning signals of a “sell in May” approaching. The factors include stock market valuations, short-term interest rates, inflation, consumer sentiment, investor sentiment, and the manufacturing purchasing managers’ index (PMI).
The prevailing trends in the three bear markets (2001, 2008 and 2022) were remarkably similar. Market valuations were heading south, CPI inflation was on the up, consumer sentiment was down, and the PMI was trending downwards. The only exception was that interest rates in 2008 were already on a downtrend compared to rising trends in 2001 and 2022. Investor confidence was in a rising trend in 2008 and 2022.
Interest rates were in a downtrend on only two occasions, while stock market valuations were in a downtrend on six occasions out of 16 observations.
Sell in May 2023?
If I were a betting man, the historical success rate of 59% means that the odds are in favour of achieving the success of “sell in May and go away”. The outlook for the US economy is darkening as the credit-tightening trend by banks is likely to continue. In addition, the Federal Reserve’s hand may be forced again because it seems that the US business cycle is proving more resilient than expected, with employment data and inflation surprising on the upside. Yes, a recession-inducing credit crunch.
No, I am not selling in May. It is also necessary to recognise that “sell in May failures” accounted for about 41% of the time in the past 27 years. When do I cut my losses by buying back again?
I may miss out on a new strong bull market that could arrive sooner than most investors and commentators expect. It could be a result of the Federal Reserve panicking by slashing borrowing costs when the economy hits the wall. Or, even better, when the guns fall silent in Ukraine.
Yes, I sit tight despite facing a possible drawdown of about 15% for about four months, as my analysis indicated.
Ryk de Klerk is an independent investment analyst.
Disclaimer: The views expressed in this article are those of the writer and are not necessarily shared by Moonstone Information Refinery or its sister companies. The information in this article does not constitute investment or financial planning advice that is appropriate to every individual’s needs and circumstances.

