

Fewer than 50% of the country’s medical schemes achieved an operating surplus in 2021 and therefore had to draw on their investment returns, placing additional pressure on their solvency levels, according to Alexforbes Health’s 2022/23 Medical Aid Insights publication.
It said 34 out of 73 schemes made an operating surplus in 2021.
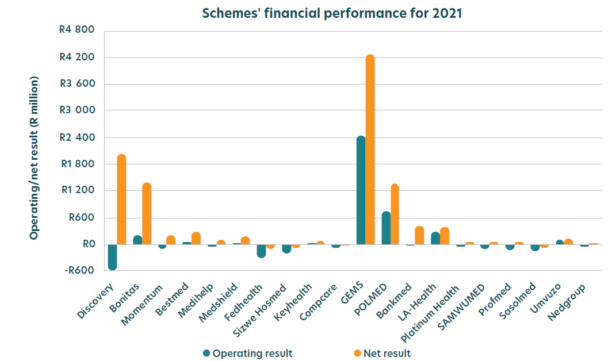
One of the key factors that is used to measure the performance of a medical scheme is its operating surplus. A scheme’s operating surplus is an indication of its financial soundness after claims and non-healthcare expenditure (NHE) are deducted from the contribution income.
Schemes that incur operating deficits must rely on investment income to subsidise claims and NHE, to achieve a net breakeven result.
In 2021, restricted schemes achieved an operating surplus of R2.72 billion, driven by the large operating surplus of R2.45bn generated by the Government Employees Medical Scheme (GEMS). If GEMS is excluded, the surplus decreases to R0.27bn.
However, only four of the top 10 restricted schemes made an operational surplus in 2021.
Open schemes incurred an operating deficit of R1.89bn in 2021, driven by the large operating deficit of R1.17bn generated by Discovery.
Similarly, only four of the top 10 open schemes experienced operational surpluses in 2021.
Investment strategies are ‘highly conservative’
In 2021, 39 out of 73 schemes failed to achieve an operating surplus and therefore had to draw on their investment returns.
“This strategy is not sustainable unless investment returns keep pace with, and preferably exceed, claims inflation. At present, however, most medical schemes follow highly conservative investment strategies,” the report said.
In 2021, open schemes held 22.3% of assets in equities, with 46.3% in bonds and 25.2% in cash. In contrast, restricted schemes held 17.5% of assets in equities, 32.3% in bonds and 45.9% in cash or cash equivalents. The balance is mainly held in property, with some exposure to debentures and insurance policies.
The regulations to the Medical Schemes Act restrict medical schemes’ asset allocation, but most schemes are operating well inside the limits for riskier asset classes. The limit on equities is 40%, while the limit on property is 10%. This implies that schemes could have up to 50% of their investments in these higher-risk asset classes, whose returns are expected to exceed CPI inflation.
There are no limits on exposure to conservative asset classes, such as cash, money market instruments, and bonds. The only restrictions on these asset classes are the exposure to specific issuers, to ensure diversification.
Medical schemes’ preference for cash appears to be driven by a preference for liquid assets, given that their liabilities are short term, as well as concerns about risks related directly to the investments (the possibility of making negative returns or losing scheme assets), the report said.
However, for the long-term sustainability of the scheme, average returns below medical inflation may pose a greater risk, particularly for schemes that rely on investment returns, when they fail to achieve an operating surplus.
“In particular, the claims expenditure tends to grow faster than CPI. To maintain solvency year on year, the accumulated funds need to increase in line with the increase in contributions. If investment returns cannot keep pace with the increase in claims inflation, and accumulated funds increase at a rate less than contributions, then solvency levels will decrease. This results in a need to either increase contributions further, which would exacerbate this issue, or reduce benefits,” Alexforbes Health said.
As a result, for schemes failing to meet the solvency requirement, low investment returns from conservative asset allocations may, in fact, be increasing risk for the scheme. For schemes meeting the solvency threshold, this can be eroded over time if returns are below claims inflation, and they may be missing an opportunity to maintain affordable contribution increases in the future.
Covid-19 was good for schemes’ net results
In 2021, with the addition of investment and other income, the industry achieved a net result of R12.18bn compared with the overall net surplus of R24.84bn in 2020.
Open schemes achieved an overall net result of R4.06bn (2020: R14.45bn), while restricted schemes achieved an overall net surplus of R8.12bn (2020: R10.39bn).
In 2021, 11 out of 17 open schemes and 53 out of 57 restricted schemes achieved a net surplus, compared with a net surplus for all open and restricted schemes in 2020. This demonstrates that the Covid-19 pandemic resulted in schemes having improved results in 2020.
And for their solvency ratios
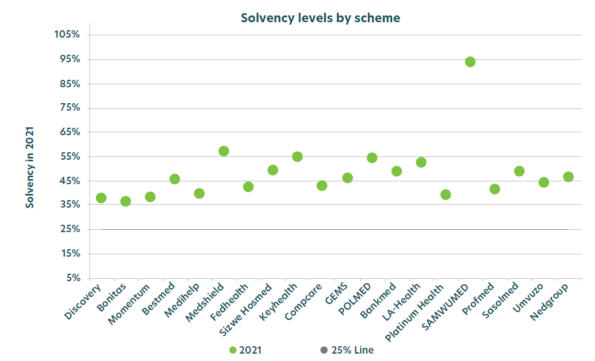
In 2020, the average solvency for all schemes increased significantly as a result of the large surpluses due to Covid-19. In 2021, the average solvency for all schemes increased to 46.7% from 44.6% in 2020.
The solvency ratio of open schemes increased from 38.7% in 2020 to 39.6% in 2021. The solvency level for restricted schemes increased from 52.5% in 2020 to 56.2% in 2021.
Sustainability improves
The report includes the Alexforbes Medical Schemes Health Sustainability Index, which attempts to assess the combined impact of key performance statistics on the sustainability of a scheme. The medical schemes are ranked from highest to lowest to show their relative sustainability.
In 2021, the industry saw a 17.4% improvement in the index score, with restricted schemes showing an improvement of 19.3%, while open schemes showed an improvement of 15.8%.
The index shows that the largest increase for 2021 were for Polmed, which improved its 2021 score by 23.2%, closely followed by GEMS, with an increase of 21.3%.
The open schemes trailed by a small margin, with Sizwe Hosmed improving its score by 19.8%, followed by Bonitas, with 18.9%.
Medshield is the highest ranked of the open schemes, followed closely by Sizwe Hosmed and Fedhealth.
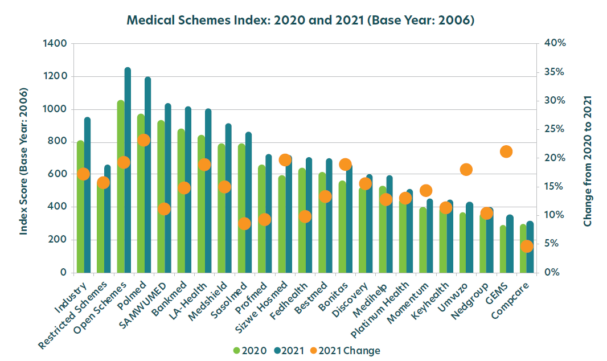
The index outputs a value that represents the sustainability of a scheme based on a number of metrics, including the:
- Size of the scheme relative to other schemes;
- Membership growth;
- Average age of beneficiaries and how it changes over time;
- Scheme’s solvency relative to the 25% requirement; and
- Trends in the scheme’s solvency over time.
The index is sensitive to the starting year used, which is 2006.

