
There is little appetite for fee-based planning, fixed fees, or consulting-based revenue among the financial advisers who participated in a survey commissioned by Allan Gray. This is one of the findings contained in the inaugural Adviser Barometer 2024/25, which was released in April.
The report, compiled by United Kingdom-based financial services-focused consultancy The Lang Cat, is derived from answers to a survey conducted towards the end of 2024. All advisers contracted with the Allan Gray Investment Platform were invited to participate, irrespective of the size of their book with the asset manager. A total of 595 individuals participated.
The Adviser Barometer aims to capture the current state of the participating advisers’ practices, their commercial realities, client propositions, use of technology, investment strategies, and outlook for the future.
Mark Polson, the chief executive of The Lang Cat, wrote in the introduction to the report that the Barometer does not pretend to be representative of the advice profession as a whole in South Africa. “Rather it’s a snapshot of Allan Gray supporters, and specifically those who are the kind of firms or people who will spend time on a survey.”
Daniel van Andel, Allan Gray’s head of adviser proposition, said: “Although we sponsored the initiative, and some skew toward supporters of our platform is to be expected, we feel the results nevertheless provide perspectives which are relevant and representative of the independent advice industry in South Africa.”
One section of the report discusses how the independent financial advisers who participated in the survey structure their remuneration and deliver services to clients.
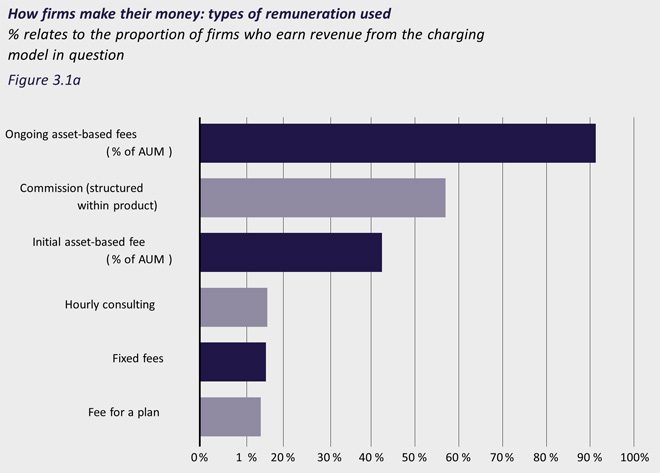
The most widely used charging model is ongoing asset-based fees, followed by commission, initial asset-based fees, hourly consulting, fixed fees, and fees for a plan.
The survey found there was not much appetite to change the remuneration model. For example, 74% of respondents have no consulting-based revenue, and they expect this to stay the same over the next five years. Only 8.5% derive some revenue from consulting and believe this will not change, whereas 15.7% think it will increase over time. Only 1.4% think their consulting-based income will decrease.
“Broadly speaking, the sector, as it appears from our survey, shows relatively little appetite for fee-based planning, fixed fees or the aforementioned consulting revenue. Initial and ongoing asset-based charges rule the roost, along with commission,” Polson said.
However, Polson said it was noteworthy that “a reasonable minority” of firms expect their remuneration from hourly consulting, fixed fees, and fees for a plan will increase as a percentage of their overall turnover over the next five years.
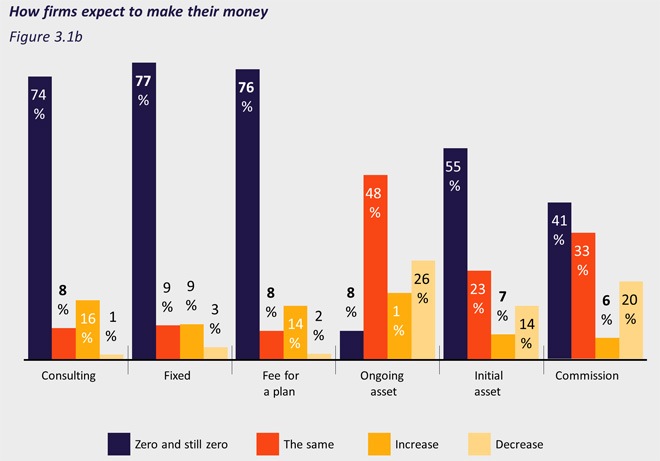
He said it was interesting that when respondents were asked about potential threats to their revenues, 26% said they expect their asset-based ongoing revenue to decrease over five years – “we wonder if this is firms anticipating overall fee compression or perhaps moving to other [remuneration] shapes”.
The survey did not find any evidence that respondents are concerned that their clients are rejecting ongoing fees. “The same is true of commission. South Africa has not headed down the UK path of full bans, but nonetheless one in five respondents reckon the share of their income generated by commission will fall,” he said.
Looking closer at ongoing asset-based fees, 48% of firms charge 0.5% annually, 34% charge between 0.5% and 0.99%, and 9% charge 1%. The weighted average ongoing fee is 0.56%, excluding one large firm that charges 1%. Compared to the UK, where the average is 0.77%, South African advisers charge less, Polson said.
Client engagement and services
Client engagement varies significantly by client wealth. The report notes that top-tier clients receive an average of 4.9 personalised contacts a year, ensuring regular touchpoints for high-net-worth individuals. Middle- and lower-tier clients, however, receive less frequent attention.
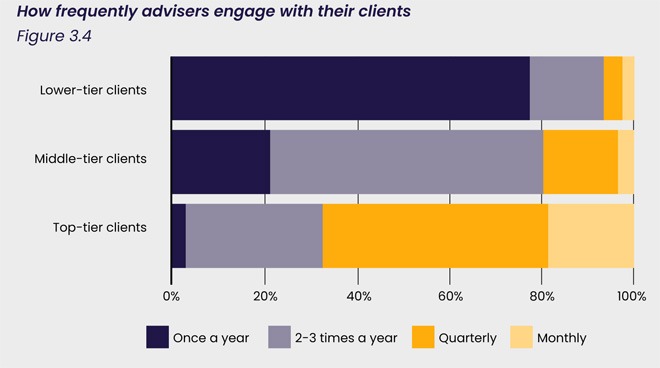
Polson said the nature of the South African market means that more clients present with single-need situations that do not necessarily justify ongoing full holistic planning relationships.
“There is an interesting challenge for firms to walk the line between keeping these relationships alive – as you never know when a client might inherit money or change their situation – and being coldly commercial. This is one area where technology really can help.”
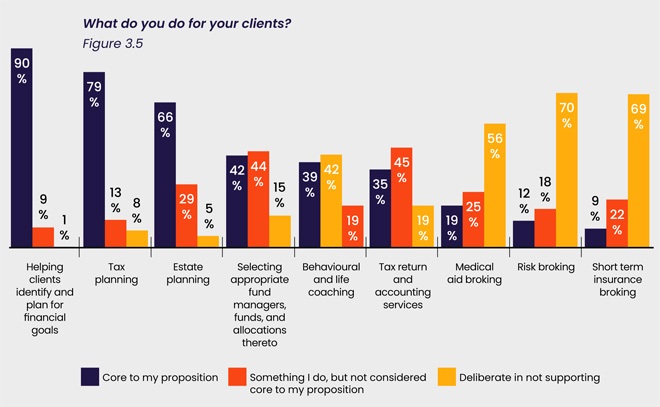
In terms of the services offered by respondents, investment advice, financial, tax, and estate planning are core to most advisers, while insurance broking is ancillary.
He noted that only 40% of respondents highlight behavioural coaching and life planning as core services, which was lower than expected and lower than what would be found in the UK, the United States, Australia, or northern Europe.
Types of investment propositions
Respondents place a premium on bespoke investment propositions, with 44% of client assets managed in portfolios tailored to individual needs. Yet there is a vibrant middle ground: in-house model portfolios capture 25% of assets, offering a balance between customisation and operational efficiency, while 22% of assets flow into outsourced DFM solutions that provide adviser-specific model portfolios.
Even among advisers who employ model portfolios, allocation varies widely: 35% dedicate 1% to 25% of their book to these models, while 27% go “all in”, allocating 76% to 100% of client AUM to them.
Appetite for offshore business
Questions about offshore capability disclosed that respondents prefer to serve demand from South Africa. A combined 61% of firms have not seriously pursued an overseas office – 33% are not likely ever to do so, and 28% might consider it in future – while just 11% either have representation abroad (5%) or have plans under way to establish and offshore office (6%).
Offshoring of assets
In terms of clients’ exposure to offshore assets, on average 77% resides in collective investment vehicles, followed by 11% in exchange traded funds, 8% in direct shareholdings, and 4% in other instruments.
When it comes to the wrappers advisers use, nearly half of offshore allocations (48%) are held in locally domiciled discretionary portfolios that invest offshore, signalling a preference for domestic platforms with international investment mandates. Foreign-domiciled discretionary accounts account for 23%, offshore endowments for 22%, and direct mandates with foreign management companies for 6%.
Looking ahead, firms are optimistic that most of these offshore assets will eventually repatriate: 68% of respondents estimate that 15% or less of their offshore AUM will be inherited by beneficiaries living outside of South Africa, while only 3% expect more than half to stay offshore.
Overall, respondents believe under a quarter of their firm’s offshore AUM will stay offshore forever, suggesting confidence in lasting ties between clients and the South African market.
Technology preferences
To explore advisers’ preferences, respondents were asked what they would do if they could wave a magic wand and reset their tech stacks from scratch without any negative repercussions.
The results disclosed a hierarchy of essentials: platforms topped the list at 82%, followed by revenue management at 66%, planning software and communications and reporting each at 60%, and CRM/practice management at 58%. This exercise underscores that, despite occasional gripes, advisers see these core systems as vital pillars of their operations.
Respondents were asked to rank what they most want technology to achieve. Leading the pack, 65% selected “ease the burden of compliance with regulation”, and an equal 65% chose “automate repetitive internal processes”. Fifty-seven percent want tech to “enhance your investment process with clients”, while 46% seek “consistent, branded client reporting”, 42% aim to “improve data security”, 39% to “build robust workflows”, and 33% to “create online portals for clients”.
The survey enquired into the extent to which firms are using Artificial Intelligence.
Only 9% of respondents have actually adopted AI, another 9% are “in the process of adopting”, 23% are “excited but yet to do anything”, 39% are “interested but need to learn”, 15% remain sceptical, and 5% “don’t know” where to begin.
Current use cases centre on Microsoft CoPilot for emails and meeting notes, as well as ChatGPT for client communications and newsletters.
AUM, client load, and pay scales
The report provides insights into the business structures, financial health, and operational dynamics of the independent financial advisory firms that participated in the survey.
On average, respondent firms oversee R1 billion of client assets, although setting aside the very largest brought that mean down to R0.5bn.
Client loads average 1 450 per firm (525 excluding the top decile) and staffing averages seven people: 1.75 owners who are also advisers, 0.25 owners who do not give advice, 1.5 non-shareholding advisers, 2.25 administrators, and 1.25 others.
Scaling up shows a predictable trend – firms with more assets under advice have more staff, and those servicing larger client bases likewise employ more people. The average asset per client climbs with client numbers too, underscoring how growth begets complexity.
When asked about adviser capacity, practitioners report managing 155 clients each on average but believe an ideal workload is 163, with a theoretical ceiling at 252 clients. Strikingly, only 15% of firms say they are “right-sized”, while more than half believe they could handle more business without sacrificing service.
Pay scales reflect role complexity: a senior adviser earns about R1.7m, an intermediate adviser R800 000, a senior administrator R400 000, a junior adviser R390 000, and a junior administrator R170 000.
Polson said these averages can hide significant variation. Respondents were asked to provide their best understanding of the pay scales in their firm, without specific guidelines on what the notion of “senior” or “junior” meant to them.
Business valuations are fairly common: 34% had formal valuations in the past year, chiefly “to sell owner/founder equity to a larger firm” or “give shares to a new director”. Yet valuations often surprise firms – with comments such as “It was too low for my liking. I thought the calculation method was wrong”, and “The initial valuation was about 45% below our internal estimate”, while one respondent reported, “Our business is valued about 6x earnings”.
Optimistic outlook
Respondents were upbeat about the prospects for both turnover and profitability in the coming year.
Nearly 70% expect turnover gains, with more than 50% forecasting increases above 10%, while only 8% see turnover falling. On profitability, about 74% expect growth (nearly half by more than 10%), and just 7% anticipate declines.
When asked to rate whether the current economic situation is placing a strain on their business – where 0 is none and 10 is an intolerable amount – the average strain rating was a middling 5.17, aligning with the bullish outlook for business.