

After a stellar performance relative to other sectors, large-cap tech stocks hit a perfect storm in 2022 as quantitative tightening and inflationary concerns threatened their superior sales growth. In turning defensive, market players moved from innovation to conservation in their risk-off strategies.
The NYSE FANG+ Index, an equal-dollar weighted index consisting of 10 of the highly traded tech giants – Meta, Apple, Amazon, Netflix, Microsoft, Google, Tesla, Nvidia, Snowflake, and Advanced Micro Devices – fell by more than 42% from the high in October 2021 to its low in December last year.
Since then, the NYSE FANG+ Index has advanced by more than 74%, wiping out all the losses since October 2021. According to Bloomberg, the rally shocked everyone. Really?
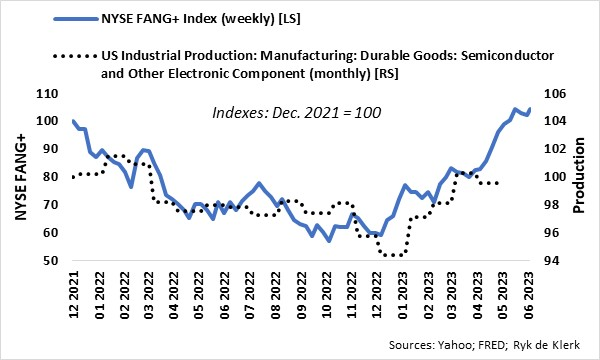
US production of semiconductors and other electronic components was moving downhill from October 2021 and declined by nearly 6% year-on-year by December last year. Since then, however, production has made up virtually all the lost ground. Yes, apart from all the hype on the back of the new buzzword, Artificial Intelligence (AI), the recovery in tech stocks is underscored by the recovery in the physical production of semiconductors and other electronic components. The rally is not just hot air!
Tech stocks have always led the way in recent bull markets. Current market behaviour is reminiscent of 2020 after the height of the pandemic crisis in 2020.
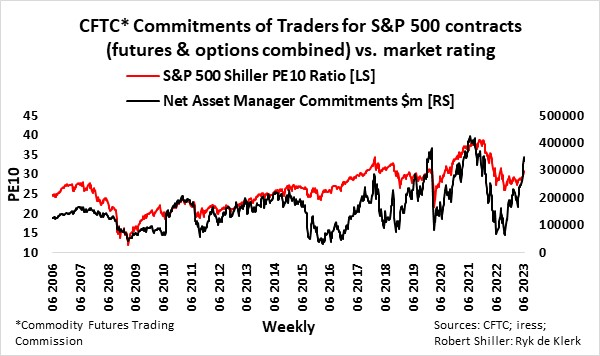
After slashing their net long positions in S&P 500 futures and options from nearly $400 billion to $100bn at the height of the pandemic, asset managers started increasing their net long positions when market valuations dropped to bargain basement levels. The PE10 ratio of the S&P 500 fell from a high of about 32 times to below 20. Asset managers continued aggressively adding to their net long positions until the end of December 2021, pushing stocks to a PE10 multiple of nearly 40 times.
In contrast, speculators, as defined by the net non-commercial interest published by the Commodity Futures Trading Commission (CFTC), were slow out of the starting blocks. They built on their short positions even when the market started to recover on the back of the push by asset manager buying but reversed their positions when the market pushed higher.
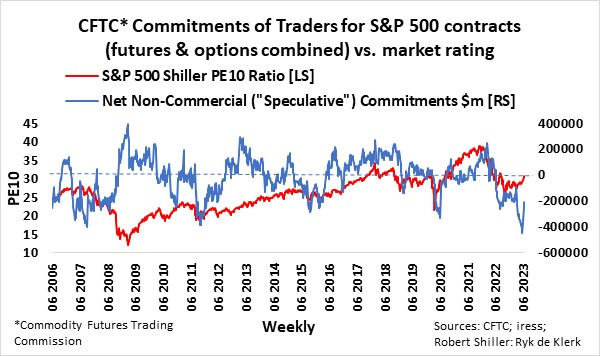
Speculators generally outsmarted asset managers at the bottoms in 2008 and 2016 but were sucked in near the end of the rallies as they cut their short positions and even went long near and after the tops in 2011, 2015 and 2021.
In the current cycle, asset managers started to cut their long positions in November 2021, reducing their exposure to about $75bn in the third quarter of last year from a high of more than $400bn. When the PE10 multiple fell below 27 in the fourth quarter, asset managers aggressively added to their long positions, which, according to CFTC data released last week, increased to about $350bn. Yes, asset managers timed the market perfectly.
The bears are capitulating, though.
Speculators did not cover their short positions after the market bottomed at the end of 2022 and doubled their short positions to more than $400bn as the rally in tech stocks pushed the S&P 500 higher in April and May. The continued push by asset manager buying forced the speculators’ hands, though, as they reversed half of their positions over the past two weeks.
Yes, they misread the market and specifically tech stocks and are getting sucked in near the top, causing the rally to broaden to sectors such as economically cyclical and other value-orientated sectors.
Furthermore, the fear of missing out (FOMO) syndrome is probably in play now as investors who lost out on the tech rally, thereby underperforming, may be under pressure from clients to increase market exposure, specifically to tech or AI stocks.
I do think that global tech shares and broad equity indexes have entered the high-risk and most dangerous stage of the rally, though.
It is evident that the net exposure to derivatives of asset managers is, in fact, an excellent way to gauge investor sentiment and, even more, is an indication of whether the market is overbought or oversold. At this stage, the market is very overbought, as the net exposure is near the highs when the overall market valuation peaked in February 2018, February 2020, and November 2021.
The trend is still up, and the peaks in the net exposure of asset managers have been in a rising trend since 2015, which leaves room for net exposure to increase to as high as $500bn.
The US Federal Reserve is likely to hike rates again in July and even a second time in the third quarter of this year. The expected credit squeeze because of the US regional bank crisis is less severe than originally anticipated. US commercial banks’ commercial and industrial loans, as well as residential real estate loans, in June indicate that the contraction is mild and could be described as a rollover instead of a fall off the cliff’s edge. The US economy is more resilient than most analysts and commentators anticipated a few months ago, while recent data also indicates upbeat consumer and business confidence.
Is this a bull trap?
Ryk de Klerk is an independent investment analyst.
Disclaimer: The views expressed in this article are those of the writer and are not necessarily shared by Moonstone Information Refinery or its sister companies. The information in this article does not constitute investment or financial planning advice that is appropriate for every individual’s needs and circumstances.

