

Until the end of February this year, the strong bull market in the S&P 500 index was underscored by increased participation by asset managers, who steadily increased their net long positions in S&P 500 futures and options on the Chicago Mercantile Exchange from 18% of the total open interest of the contracts in November 2023 to 36% in February.
Their participation tanked with the sell-off in March and April, and although they returned to the market, their participation is still way below the previous trend. It seems that asset managers are nervous and do not trust the new highs of the S&P 500 Index.
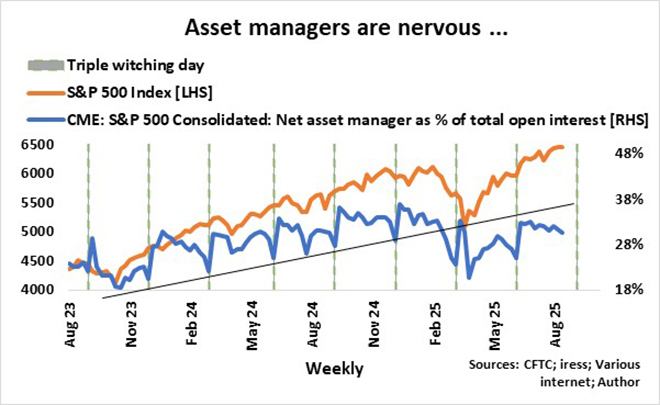
The pullback of asset managers’ net positions as a percentage of total open interest before and at triple witching days (when stock options, stock index futures, and stock index options expire near-simultaneously) is mostly “due to traders building on or adjusting positions ahead of expiration day and asset managers closing positions ahead of potential volatility that the expiration process may create” (AI).
The jump in asset managers’ net positions as a percentage of total open interest immediately after triple witching days is partly because of the expiration of the said instruments but also because of the rapid increase in covered call and other option strategies by funds and ETFs offering “equity-like returns with lower risk via options selling … (and) turning (the strategies) into a mainstream income play for retail investors and advisers alike”. (Benn Eifert, managing partner and co-CIO at QVR Advisors).
Covered call and other option strategies are massive. Last week, Reuters reported that Morningstar data indicates that US derivative income funds, primarily made up of covered call strategies, attracted a record $31.5 billion in the first half of this year, lifting the total net assets to a record $145bn. The total option exposures probably run into trillions if the in-house strategies of large financial institutions are included.
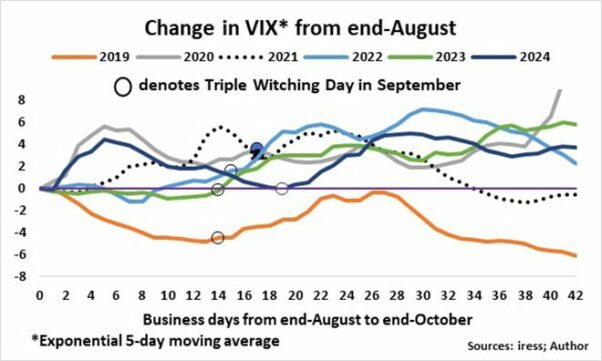
To get a feel of how volatility will evolve over the next two months, I plotted the change in VIX (Chicago Board Options Exchange’s Volatility Index) from the end of August as a base in each year since 2019 and indicated the triple witching days in September of each year. In 2020, 2021, and 2024, volatility spiked in the first two weeks of September, but at triple witching day, VIX was significantly higher than the end of August in 2020 and 2021 only. In 2019, VIX was significantly lower at triple witching day, while it was marginally higher in 2022 and unchanged from the end of August in 2023 and 2024. It therefore seems that volatility could remain in check until triple witching day (19 September) and therefore commensurate relatively stable S&P 500 index levels.
Recent history tells me that asset managers have good reason to be nervous, though. Volatility in all six years since 2019 moved higher after triple witching dates. VIX increased by 4 on average, while the average duration of the initial bottom to top was 10 business days after triple witching day.
Yes, I sense an eerie calm before the storm. At this stage of the cycle, I prefer downside protection, low beta stocks, and hard assets such as gold instead of call premium income on tech-laden stock indices.
Ryk de Klerk is an independent investment analyst.
Disclaimer: The views expressed in this article are those of the writer and are not necessarily shared by Moonstone Information Refinery or its sister companies. The information in this article does not constitute investment or financial planning advice that is appropriate for every individual’s needs and circumstances.

