

Global equity general funds have far out-performed unit trusts in the other major unit trust categories over the past decade, according to research by Morningstar Investment Management South Africa.
The average global equity general fund delivered a return of 13.3% a year over the past 10 years, says Michael Dodd, senior fund analyst at Morningstar Investment Management SA. It out-performed the next best-performing category, South African multi-asset high equity, by almost 6% a year over the same period. These funds delivered 7.5% a year.
The 10-year returns for the other six major Association for Savings and Investment South Africa (Asisa) categories fund categories were:
- South African equity general: 7.3%;
- South African multi-asset low equity: 6.9%;
- South African interest-bearing short term: 6.8%;
- South African multi-asset income: 6.8%;
- South African interest-bearing variable term: 6.4%; and
- South African interest-bearing money market: 6.1%.
South Africa’s annual inflation rate has been 5.2% over the past 10 years. This means the average balanced fund has delivered about CPI + 2% over this period, which is well below the returns these funds aim to deliver, Dodd says.
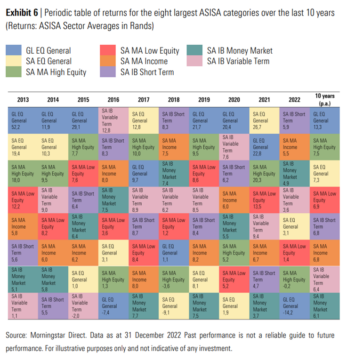
Returns measured to the end of May 2023 show that the performance trends of the past decade have generally continued, he says. The global equity general category has produced an average return of 24% (in rands), propelled by stronger equity markets and a weaker rand.
In contrast, the average South African multi-asset high-equity fund has delivered 6%, and the average South African multi-asset income fund has delivered 2%.
Dodd cautions against extrapolating recent trends into the future and assuming the coming decade will look much like the last.
Investment markets and economies tend to move in cycles, and what worked in one cycle may not necessarily work in the next, he says. As the standard disclaimer on many fund fact sheets states: past performance is not indicative of future results.
Where the money has flowed
The focus of Dodd’s analysis was trends in investment flows into the fund categories, not performance.
The South African collective investment scheme industry has grown in terms of assets under management (AUM) and the number of funds over the past decade, amid “unexciting and pedestrian” returns from the domestic asset classes, he says.
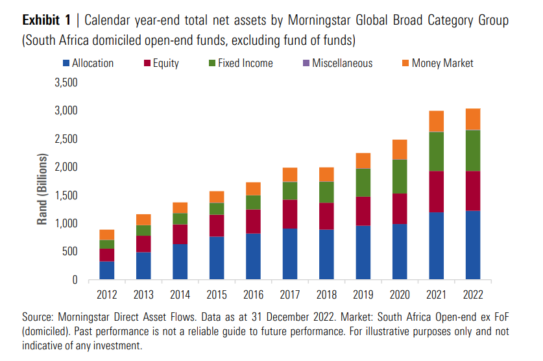
At the end of 2012, about 900 South African-domiciled funds were available for investment. Since then, this number has almost doubled to about 1 750 funds. At the end of 2022, AUM in South African-domiciled open-end funds was slightly more than R3 trillion.
The chart labelled Exhibit 1 illustrates the overall growth of total net assets held in South African-domiciled funds over the past decade, broken down into Morningstar’s global broad category groups. These are defined as follows:
- Allocation: Consists of multi-asset class portfolios that seek to provide both capital appreciation and income by investing in three major areas: stocks, bonds, and cash. In the South African fund context, this category is made up of local and global multi-asset funds, such as balanced funds and flexible funds.
- Equity: Consists of funds that invest primarily in stocks. In the South African context, this includes local and global equity portfolios, as well as real estate portfolios.
- Fixed Income: Consists of funds that invest in fixed-income securities, including bonds and/or money market securities. In the South African context, this includes the local and global interest-bearing funds (short term and variable term), as well as multi-asset income funds.
- Money Market, which consists of funds that invest in shorter-dated money market securities.
- Miscellaneous, which covers portfolios that do not fit into any of the above categories.
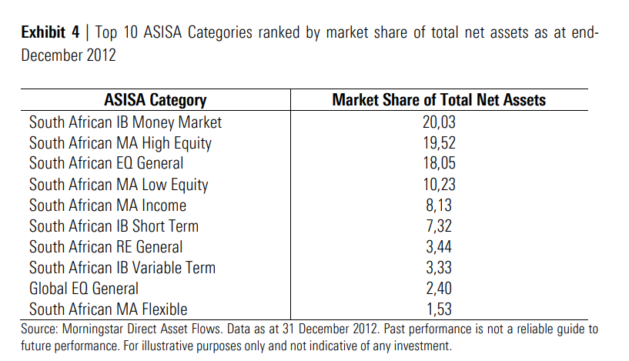
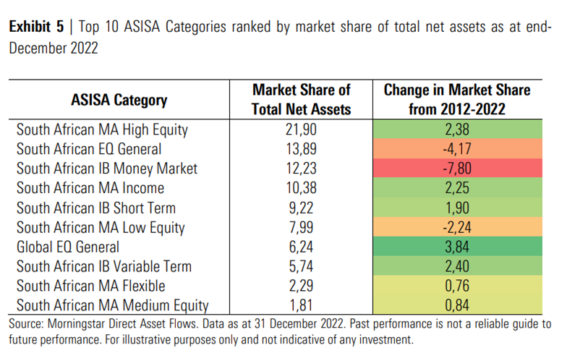
The Asisa fund categories provide a more detailed picture of some of the trends in the Morningstar categories. The two tables below capture the market shares of the top 10 Asisa fund categories by total net assets at the end of 2012 and 10 years later.
Allocation funds dominate
The South African fund landscape is dominated by Allocation funds. At the end of 2022, Allocation funds accounted for 40% of the total net assets in South African-domiciled funds.
South Africa is somewhat unique in this instance, Dodd says. In the United States and the United Kingdom, for example, Allocation funds have market shares of only 5.8% and 14.2% respectively, and the Equity category is far more prominent.
He says the dominance of the Allocation category in South Africa is likely a result of the regulatory framework governing retirement savings – specifically, Regulation 28 of the Pension Funds Act. Most funds that fall into the South African multi-asset high-equity category – the Asisa category with the highest total net assets – are Regulation 28-compliant balanced funds.
The Allocation category has seen inflows dry up in the latter part of the past 10 years, Dodd says.
With relatively lower interest rates and, therefore, lower cash yields on offer, Money Market funds have similarly been out of favour from a flow perspective. The major exception to this was the 2020 calendar year, as the heightened market volatility related to the Covid-19 pandemic saw investors seeking refuge in cash.
Investors move up the yield curve
The market share of Fixed Income funds has increased over the past decade. The Fixed Income category had a market share of 24% at the end of 2022, up from 17% 10 years prior.
Most of this increased market share has been at the expense of the Money Market category, whose market share declined from 20% to 12%. It has also been taken, to a lesser extent, from the Equity category, whose market share declined from 26% to 23% Dodd says.
He says the likely reason for the growth in the Fixed Income category is the relatively low interest rates and rising bond yields over the past 10 years, which has seen investors move their income assets up the yield curve in search of better real returns.
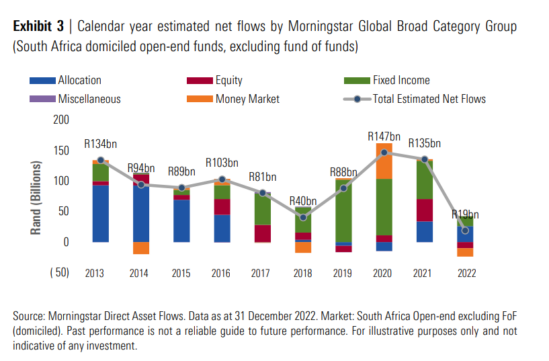
The increased demand for Fixed Income funds can be seen in Exhibit 3, which shows the estimated net flows into the Morningstar global broad category groups per calendar year for the past 10 years. Fixed Income was the only category that saw net inflows in every calendar year, and it was the most in-demand category from 2017 to 2021.
The increased market share and demand for income funds have seen substantial growth in the number of funds available for investment in the three Asisa categories of multi-asset income, interest-bearing short-term, and interest-bearing variable term.
Over the past 10 years, the number of different funds in these categories has doubled, from roughly 130 funds at the end of 2012 to roughly 260 funds at the end of 2022.
Linked to the trend of the rising demand for Income funds, funds in the conservative multi-asset low-equity sub-category have seen a drop in popularity and market share over the past decade.
Most equity flows into global funds
The generally positive net flow into Equity funds obscures an underlying trend in some of the Equity sub-categories. Specifically, when looking at the Asisa fund category flows, the estimated net flows into global equity funds have been more than double those of South African equity funds, Dodd says.
It should be noted that this analysis captures only the flows into South African-domiciled funds. Therefore, it does not capture that many South African investors may have externalised some of their assets and invested in funds domiciled offshore. So, the trend of money being moved into offshore assets could be even greater than what looking at it through the lens of fund flows suggests, Dodd says.
The rise of global equity funds at the expense of South African equity funds has been driven by the considerable outperformance of the global equity market in rand terms compared with every South African asset class over the past decade, he says.
Another factor may be regulatory changes. At the end of 2012, Regulation 28 permitted a maximum offshore exposure of 25%, with an additional 5% offshore allowance for investment in Africa. Fast forward 10 years, and the maximum offshore limit permitted by Regulation 28 is 45%.
The number of funds in the Asisa global equity general category exploded from about 30 funds at the end of 2012 to about 130 funds at the end of 2022.
Real estate funds out of favour
The once-popular category of South African real estate funds has seen a notable decline after a particularly tough decade for the asset class, Dodd says.
The category’s market share peaked at the end of 2012 at 3.44%, but in the wake of the sector’s poor performance over the past decade, it has shrunk not only in market indices, but also in popularity among investors.
The market share of the South African real estate category has more than halved over the past decade, to 1.28% at the end of 2022.
Not the full picture
Dodd points out that the trends in fund flows do not provide a full picture of the South African savings landscape. There are many areas of South Africans’ savings that fall outside of the construct of these investment vehicles, such as savings in bank accounts and banking products, money invested in direct stocks through brokerage accounts, and money that has been externalised for direct offshore investment.


Hi
Where can I get copies of all historical fund fact sheets (MDD) for SA Unit Trust Funds ?
Thanks
Albie