
After a tumultuous five months in which stock markets went from boom to bust and experienced a massive recovery, most investors breathed a huge sigh of relief now that the so-called Fear Index (VIX) has dropped to neutral or calmer levels. The big question is, where to from here?
The CBOE Volatility Index (VIX), according to Wikipedia, is a measure of the stock market’s expectation of volatility based on S&P 500 index options. Higher volatility, reflected by the VIX, indicates greater perceived market risk, and market participants are willing to pay more for insurance against large upswings or downswings.
The VIX is highly influenced by intraday and even second-by-second fluctuations in S&P 500 futures and options on futures prices, and it is not always a true reflection of the actual volatility of the S&P 500 index 30 days hence. Various other factors contribute to intraday volatility and the VIX, such as options and futures’ expiry and the opening of big hedging positions at a given date.
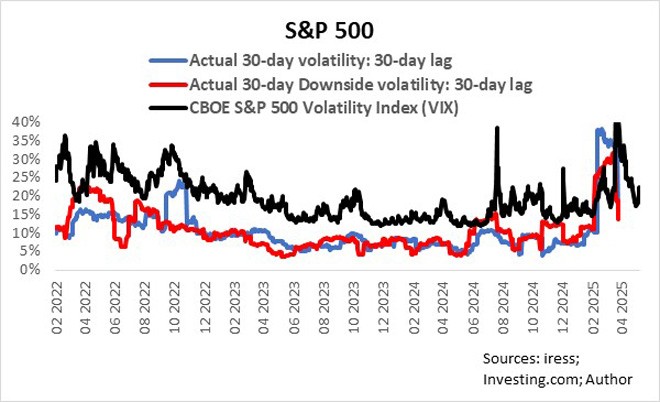
Risk per se is the probability of losing money on an investment. I am therefore more interested in the downside risk or bad volatility of an asset class, using the standard deviation of negative daily returns over the measurement period based on closing index levels, annualised by multiplying the result by the square-root of 252 (the standard number of trading days in the United States).
The average short-term (30-day) downside risk (volatility) of the S&P 500 index since 2017 has been about 11%, with a standard deviation of 8%. Large spikes in downside risk are generally event-driven and specifically crisis-driven, such as the escalations and de-escalations in the trade war in 2018/19, Covid-19, Russia’s invasion of Ukraine in February 2022, and President Donald Trump announcing his “Liberation Day” tariffs on April 2 this year.
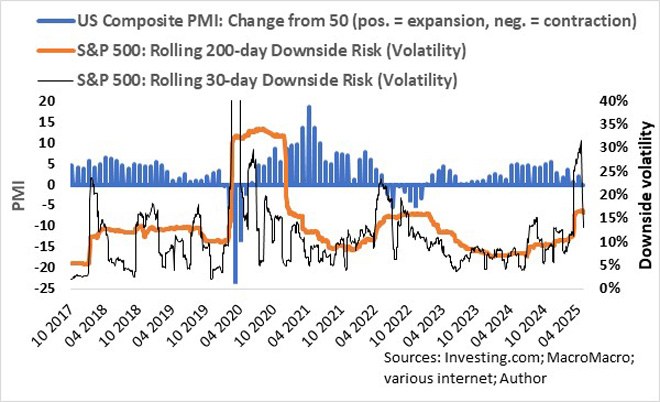
The trend in downside risk is more important than short-term spikes, however, because it gives an indication of the underlying risk of investing in a specific asset class. Furthermore, the relative risk of investing in different asset classes can be ascertained. The rolling 200-day downside risk is an excellent indicator of actual downside risk, and even more so, downside risk runs in cycles.
From the accompanying graph, it is evident that the downside risk cycles tend to reflect the underlying trend in the US economy as represented by the US Composite PMI – a weighted average of the manufacturing output index and services business activity index (Trading Economics). The S&P 500’s 200-day downside risk increases when economic expansion slows and contracts, while the downside risk decreases when the economy starts to gain traction again.
Uncertainty about the US economy plays a significant role in market players’ assessment of risk, though.
The 200-day downside risk of the S&P 500 increased from about 3% to plateau at 12% when the trade war started in 2017 and remained at that level for 18 months. Downside risk jumped to more than 33% with the outbreak of the Coronavirus pandemic in 2020 and lasted nine months. Quantitative tightening by the US Federal Reserve on the back of surging inflation and soaring energy prices following Russia’s invasion of Ukraine early in 2022 saw the downside risk increase to 14% from 8%, and it remained at that level for about eight months.
The current upward cycle in downside risk started in August last year when it bottomed at 7%, and it seems as if it reached a plateau at about 18%. How long the downside risk of the S&P 500 will remain elevated at current levels depends on how the US economy will play out over the next few quarters. Uncertainty is already overwhelming analysts, as FactSet indicated last week that analysts are making larger cuts than average to earnings per share estimates for S&P 500 companies.
For the US economy to turn for the better, trade wars should subside, or countries should at least reach finality on tariffs, and the Fed should cut rates. Although there is a higher-than-average probability of the latter, there is a low probability of the former. At this point, my best view on the US stock market is to expect more of the same through to the end of this year – namely, 200-day rolling downside risk of about 18% for the S&P 500 index, while the 30-day downside risk one standard deviation of 8% higher or lower than the longer-term downside risk.
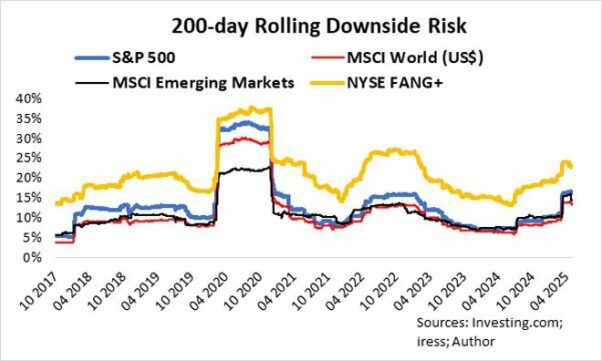
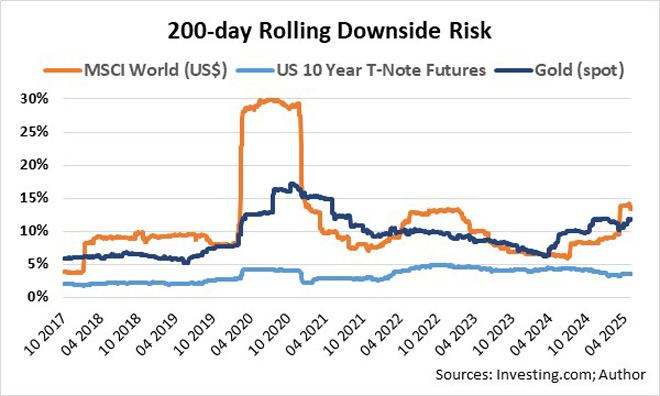
Global stock indices in general have displayed similar rolling downside risk characteristics as the S&P 500 index. The downside risk of both the MSCI World (developed) and MSCI Emerging Markets indexes in US dollars is 3% to 5% lower than that of the S&P 500 index, while the risk premium of the NYSE FANG+ Index (an equal-dollar weighted index consisting of 10 highly traded growth stocks of technology and tech-enabled companies) is consistently between 6% and 12% higher than the S&P 500.
The downside risk of Bitcoin has stabilised, with its 200-day rolling downside risk ranging between 25% and 30%, and it is approaching the downside risk of the NYSE FANG+ index.
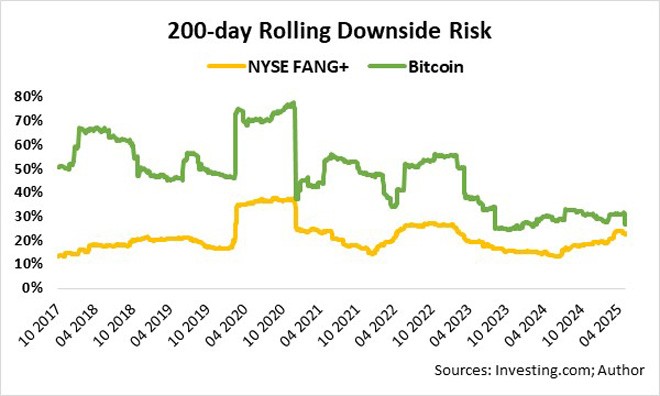
Therefore, going forward, it is fair to expect that the trend in the downside risk of global stock markets in general and even Bitcoin will continue to be highly influenced by the S&P 500’s rolling downside risk trend.
Gold (spot) bullion’s 200-day downside risk is less cyclical than that of stocks and therefore serves as a great asset to mitigate overall downside risk in a well-diversified investment portfolio. Considering the expected continued elevated downside risk trend of global stocks through to the end of 2025, the metal has earned its rightful place in my long-term portfolio.
The capital risk of investing in US 10-year government bonds, measured by the 200-day downside risk of US 10-Year T-Note futures, is significantly lower than stocks in general and lower than gold. The current yield to maturity of 4.4% adequately compensates me for the 4% downside risk currently.
Yes, I need to pinch myself repeatedly. The US economy is the catalyst for volatility!
Ryk de Klerk is an independent investment analyst.
Disclaimer: The views expressed in this article are those of the writer and are not necessarily shared by Moonstone Information Refinery or its sister companies. The information in this article does not constitute investment or financial planning advice that is appropriate for every individual’s needs and circumstances.